The Overview
One laboratory at a time: everything from Lab Health down to the Key Takeaway is Lab Health.
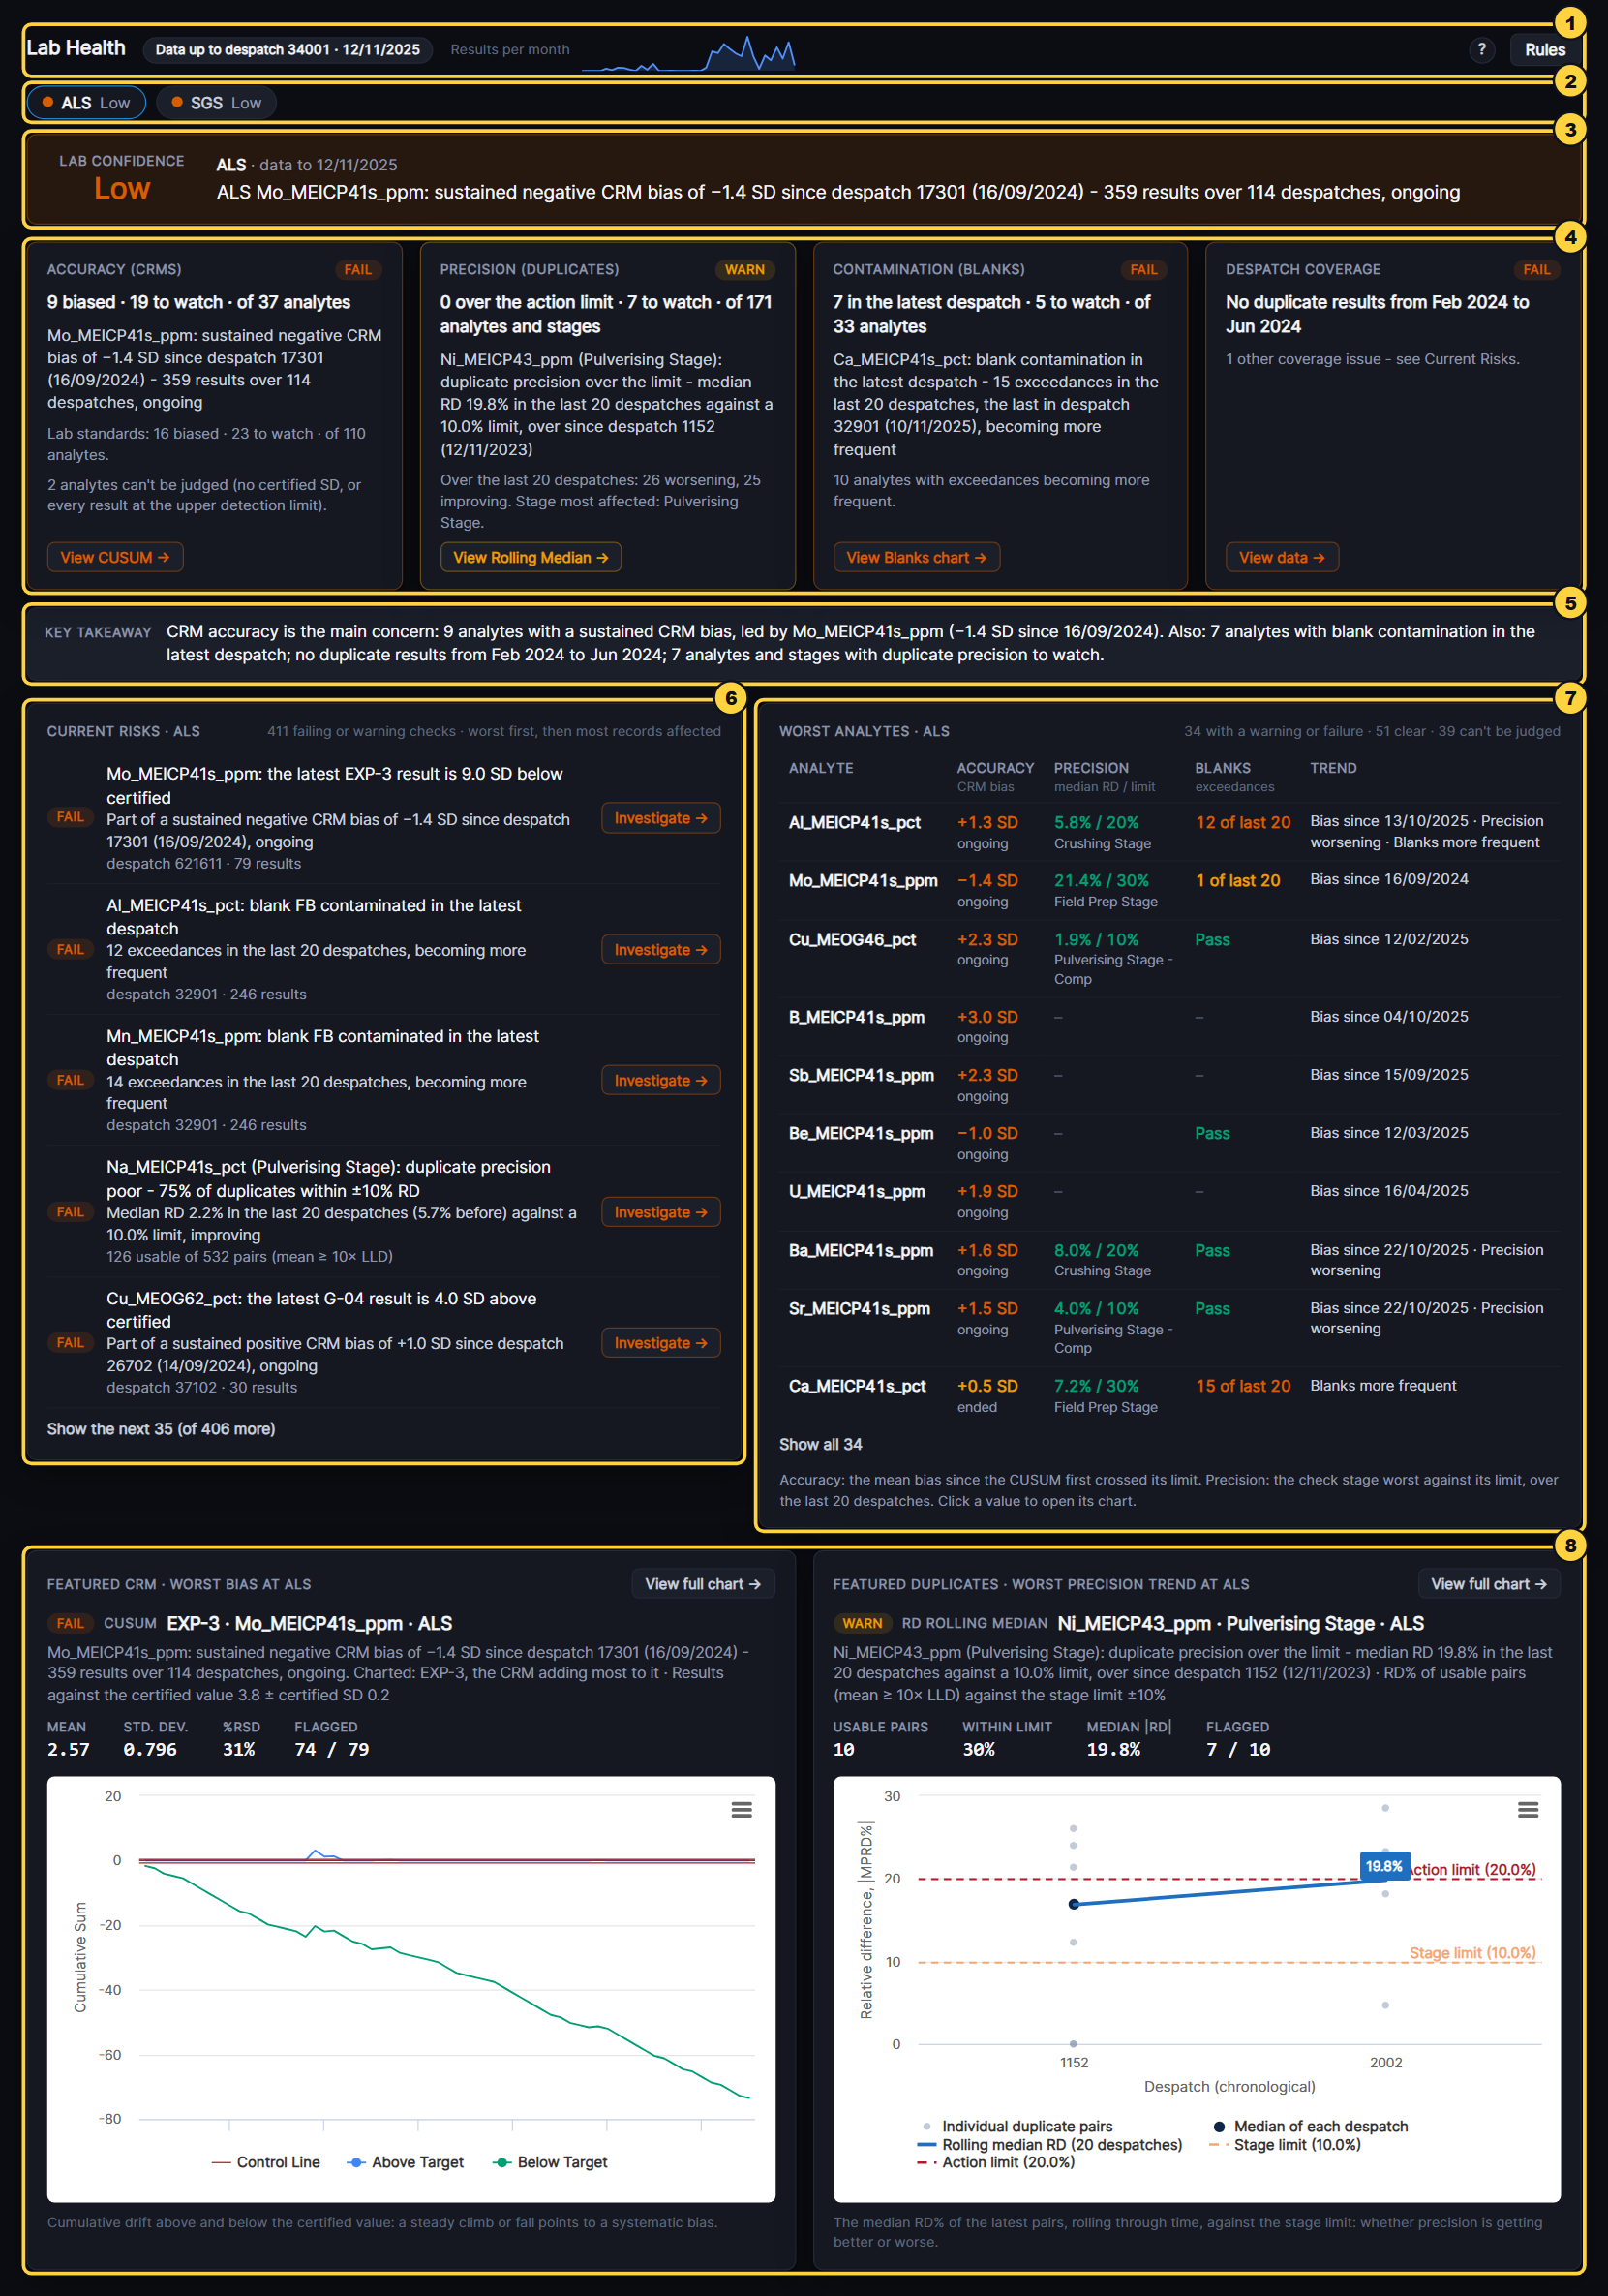
- Lab Health: How far the data goes, results per month, and the Rules button for how the checks are judged.
- Lab switch: The laboratory shown; the dot is its Lab Confidence. It opens on the lab picked in the Filters on another tab, else the lab with the newest data.
- Lab Confidence and headline: High, Moderate, Low or Insufficient data, with the laboratory’s most serious finding in one sentence.
- Domain cards: Accuracy (CRMs), Precision (duplicates), Contamination (blanks) and Despatch coverage: each with a status, its worst finding and a button to the chart behind it.
- Key Takeaway: The laboratory summed up: the main concern, what else to watch, and what’s fine.
- Current Risks: The laboratory’s failing and warning checks, worst first. Investigate or View data opens each one.
- Worst analytes: Analytes with a problem, one row each: CRM bias, duplicate precision, blank exceedances and trend. Click a value to open its chart.
- Featured charts: The laboratory’s worst bias (CUSUM) and worst precision trend (RD Rolling Median). View full chart opens it on the Charts tab.