The Charts tab
The menu on the left fine-tunes the chart and its sections change with the chart you choose. Simple hides the specialist options; Advanced shows everything. The chart area shows the chart and how it is worked out.
Menu: 2D stereonet
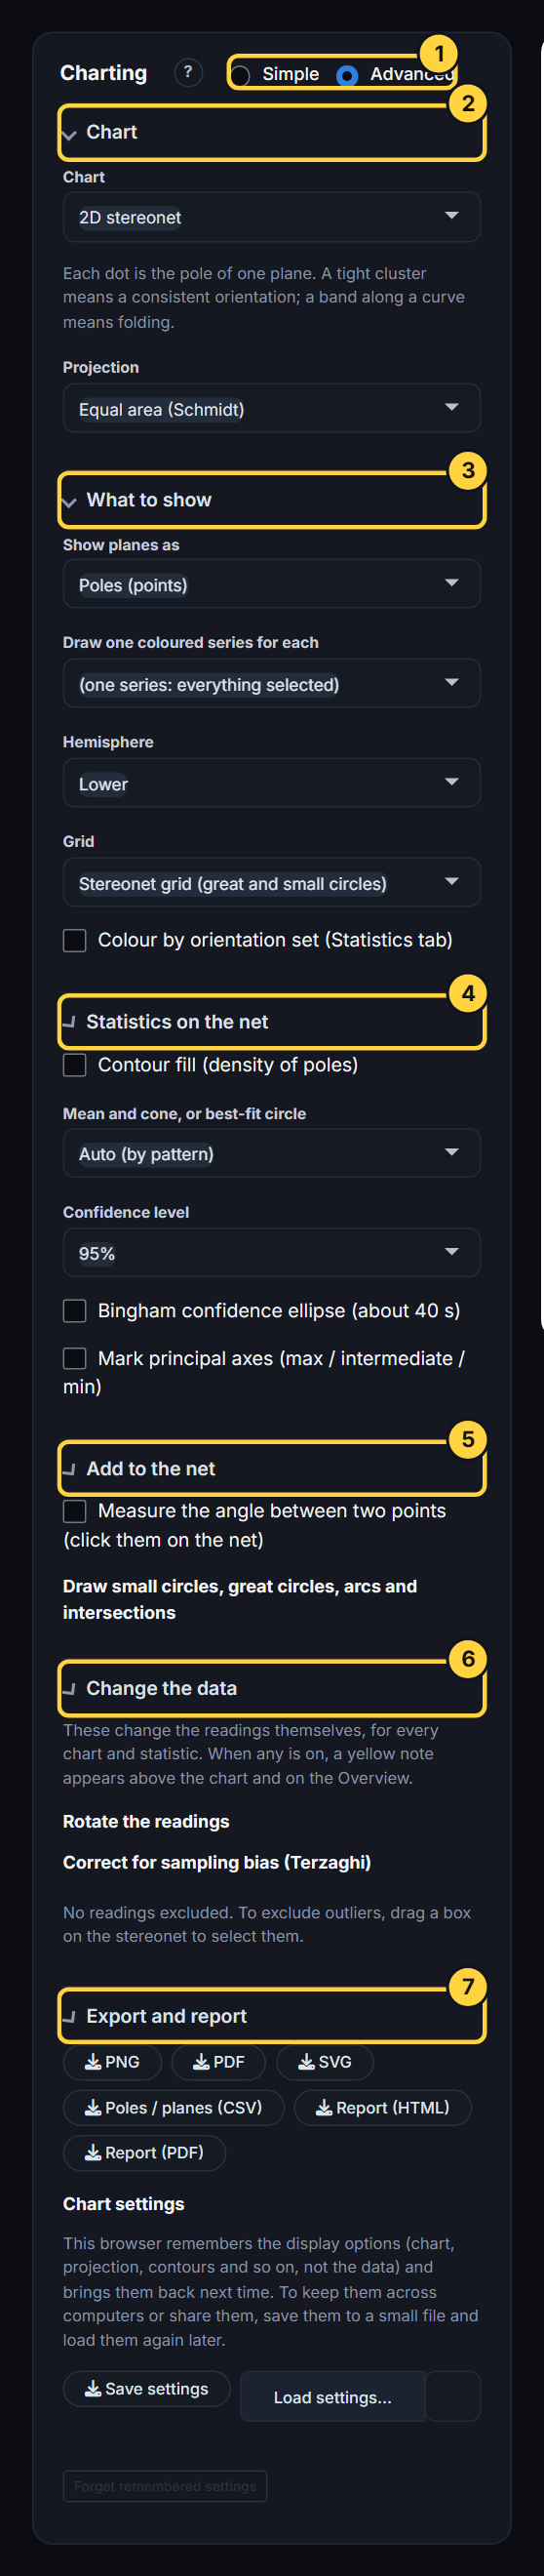
- Simple / Advanced: Simple shows the common options. Advanced adds the hemisphere and grid, contour methods and levels, principal axes, small circles, the data changes and saved settings.
- Chart: Which chart, and its own basics (the projection for the stereonet).
- What to show: Poles or great circles, one coloured series for each structure type or domain, and (Advanced) the hemisphere, the grid and set colours.
- Statistics on the net: Contour fill of the density of poles, the mean and its cone or the best-fit girdle and fold axis, the confidence level, the Bingham ellipse and the principal axes.
- Add to the net: Measure the angle between two points by clicking them, and draw small circles, great circles, arcs and the intersection of two planes from typed values.
- Change the data: Rotate, unfold a fold, weight for sampling bias, or leave readings out. These change the readings themselves, so a yellow note says so on every chart and on the Overview.
- Export and report: The chart as PNG, PDF or SVG, the plane and pole values, and a one-click report (HTML or PDF) with the chart, the statistics and the data checks. Advanced: save your chart settings and load them later.
Menu: rose diagram
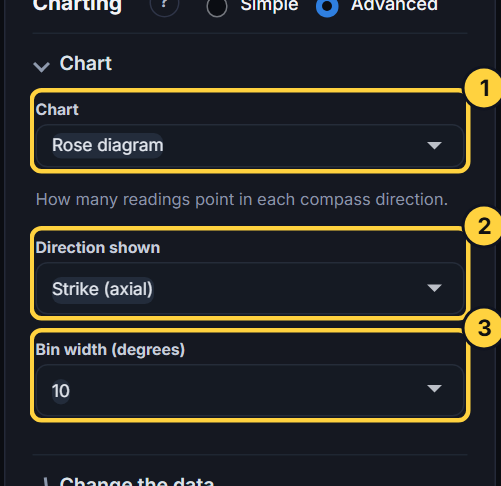
- Chart: Rose diagram: how many readings point each way, as petals around the compass.
- Direction shown: For planes, the strike (a plane has two ends, so the petals are drawn both ways) or the dip direction.
- Bin width: The size of each petal in degrees. Narrower shows detail but is noisier.
Menu: depth strip log
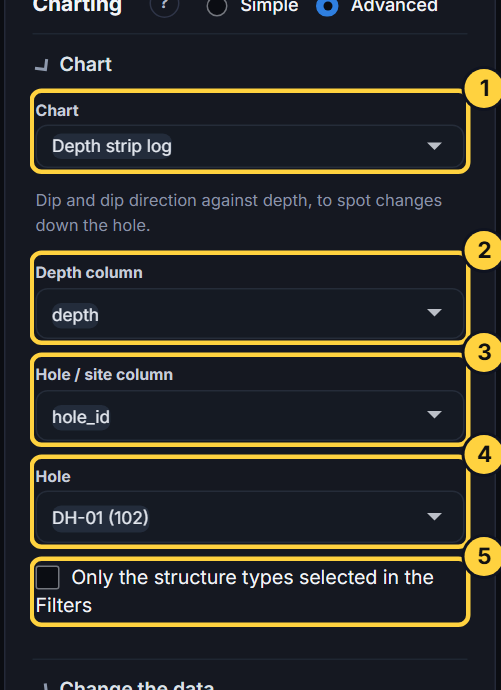
- Chart: Depth strip log: each reading as a tick at its depth down the hole, coloured by dip or by structure type.
- Depth column: The column holding the depth of each reading.
- Hole / site column: The column that says which hole or site each reading is from.
- Hole: One hole to log, or all of them.
- Only the structure types selected in the Filters: Tick to log only the types chosen in the Filters. Otherwise every structure in the file is shown.
Menu: fracture frequency
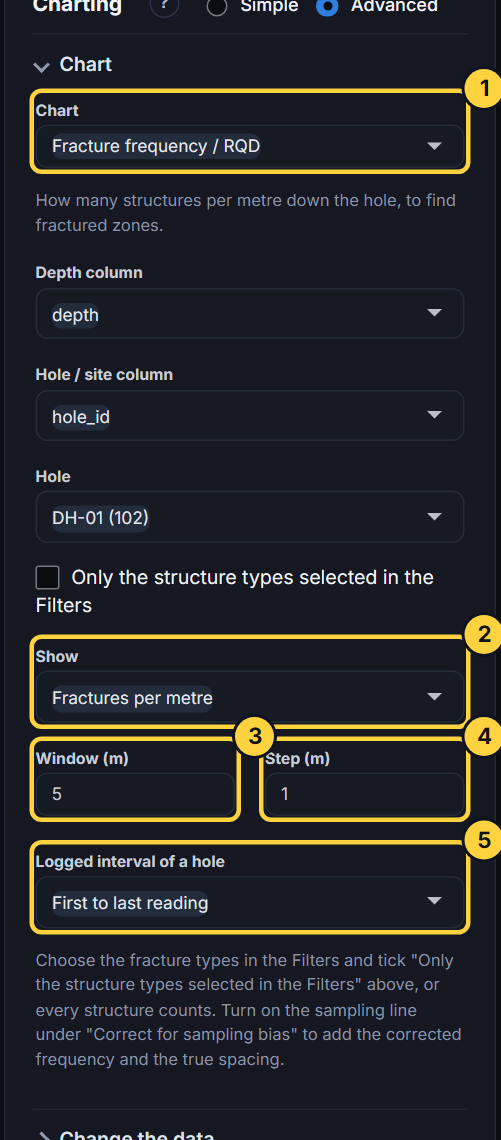
- Chart: Fracture frequency / RQD: the number of fractures per metre, or the rock quality designation, down each hole.
- Show: Fractures per metre, or RQD in percent worked out from the depths (core pieces 10 cm and longer between breaks).
- Window: How long a stretch of hole each value covers, in metres.
- Step: How far the window moves along the hole between values, in metres.
- Logged interval of a hole: The length of hole that was logged, which sets where the first and last windows lie: first to last reading, 0 m to the last reading, or typed.
Menu: attribute chart
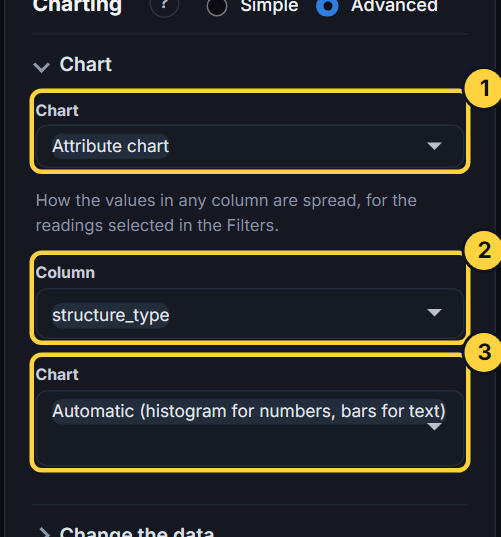
- Chart: Attribute chart: how any column of your file is spread, for the readings chosen in the Filters.
- Column: The column to chart. Numbers give a histogram, text gives bars.
- Chart: Automatic picks histogram for numbers and bars for text; or choose a histogram, cumulative percent, bars or a pie.
Chart area
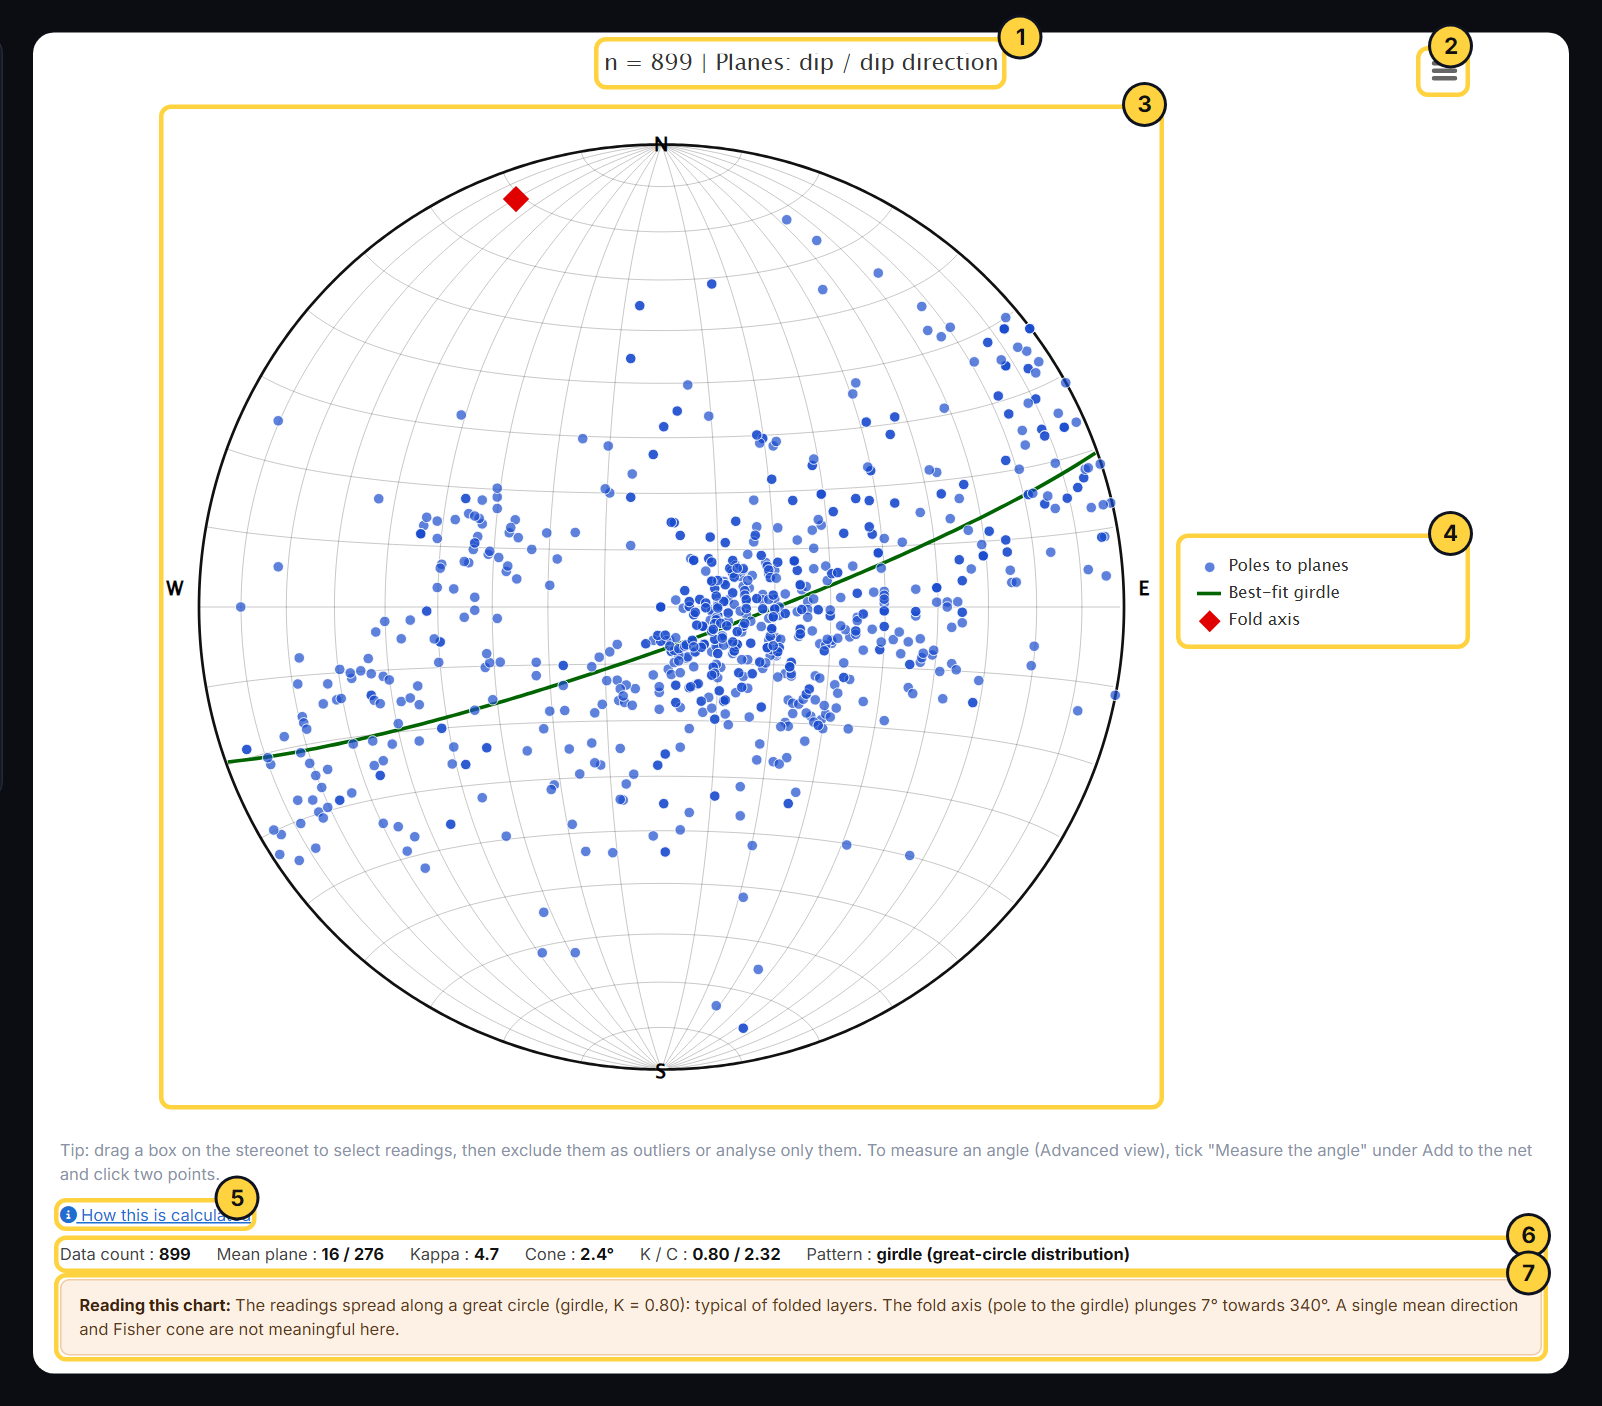
- Title: How many readings, the measurement type and which structure type or domain.
- Chart menu: Print, or download the chart as an image.
- The chart: Point at a reading to see its details. Drag a box to select readings (then exclude them, analyse only them, or restore).
- Legend: Click an item to hide or show it.
- How this is calculated: The method behind the chart with this chart’s own numbers.
- Statistics: Readings, mean orientation, kappa, cone, K and C, and the pattern found.
- Reading this chart: What the result means in plain words, for this data.