Student guide: Data health and Data
A log is only as good as the data behind it. The Data health tab lists what the import found in the workbook: problems in the site’s data, and what the app assumed. The Data tab shows every sheet as the app read it. Look at both whenever a log surprises you.
Nothing in your data is changed. The app reports what looks wrong, says why it matters and what to do, and leaves the fixing to the database, where it belongs.
1. Reading the findings
The counts at the top, also on the load line under the header, sort the findings into three kinds:
| Kind | Means | Example |
|---|---|---|
| To fix (red) | The log can’t be drawn right until the data are changed. | A sheet is missing; an interval’s FROM is deeper than its TO. |
| To check (amber) | Probably a problem in the site’s data. | Two overlapping intervals; a survey that jumps 30° between stations. |
| For information (grey) | What the app found or assumed. | Which categories exist; which sign the dips use. |
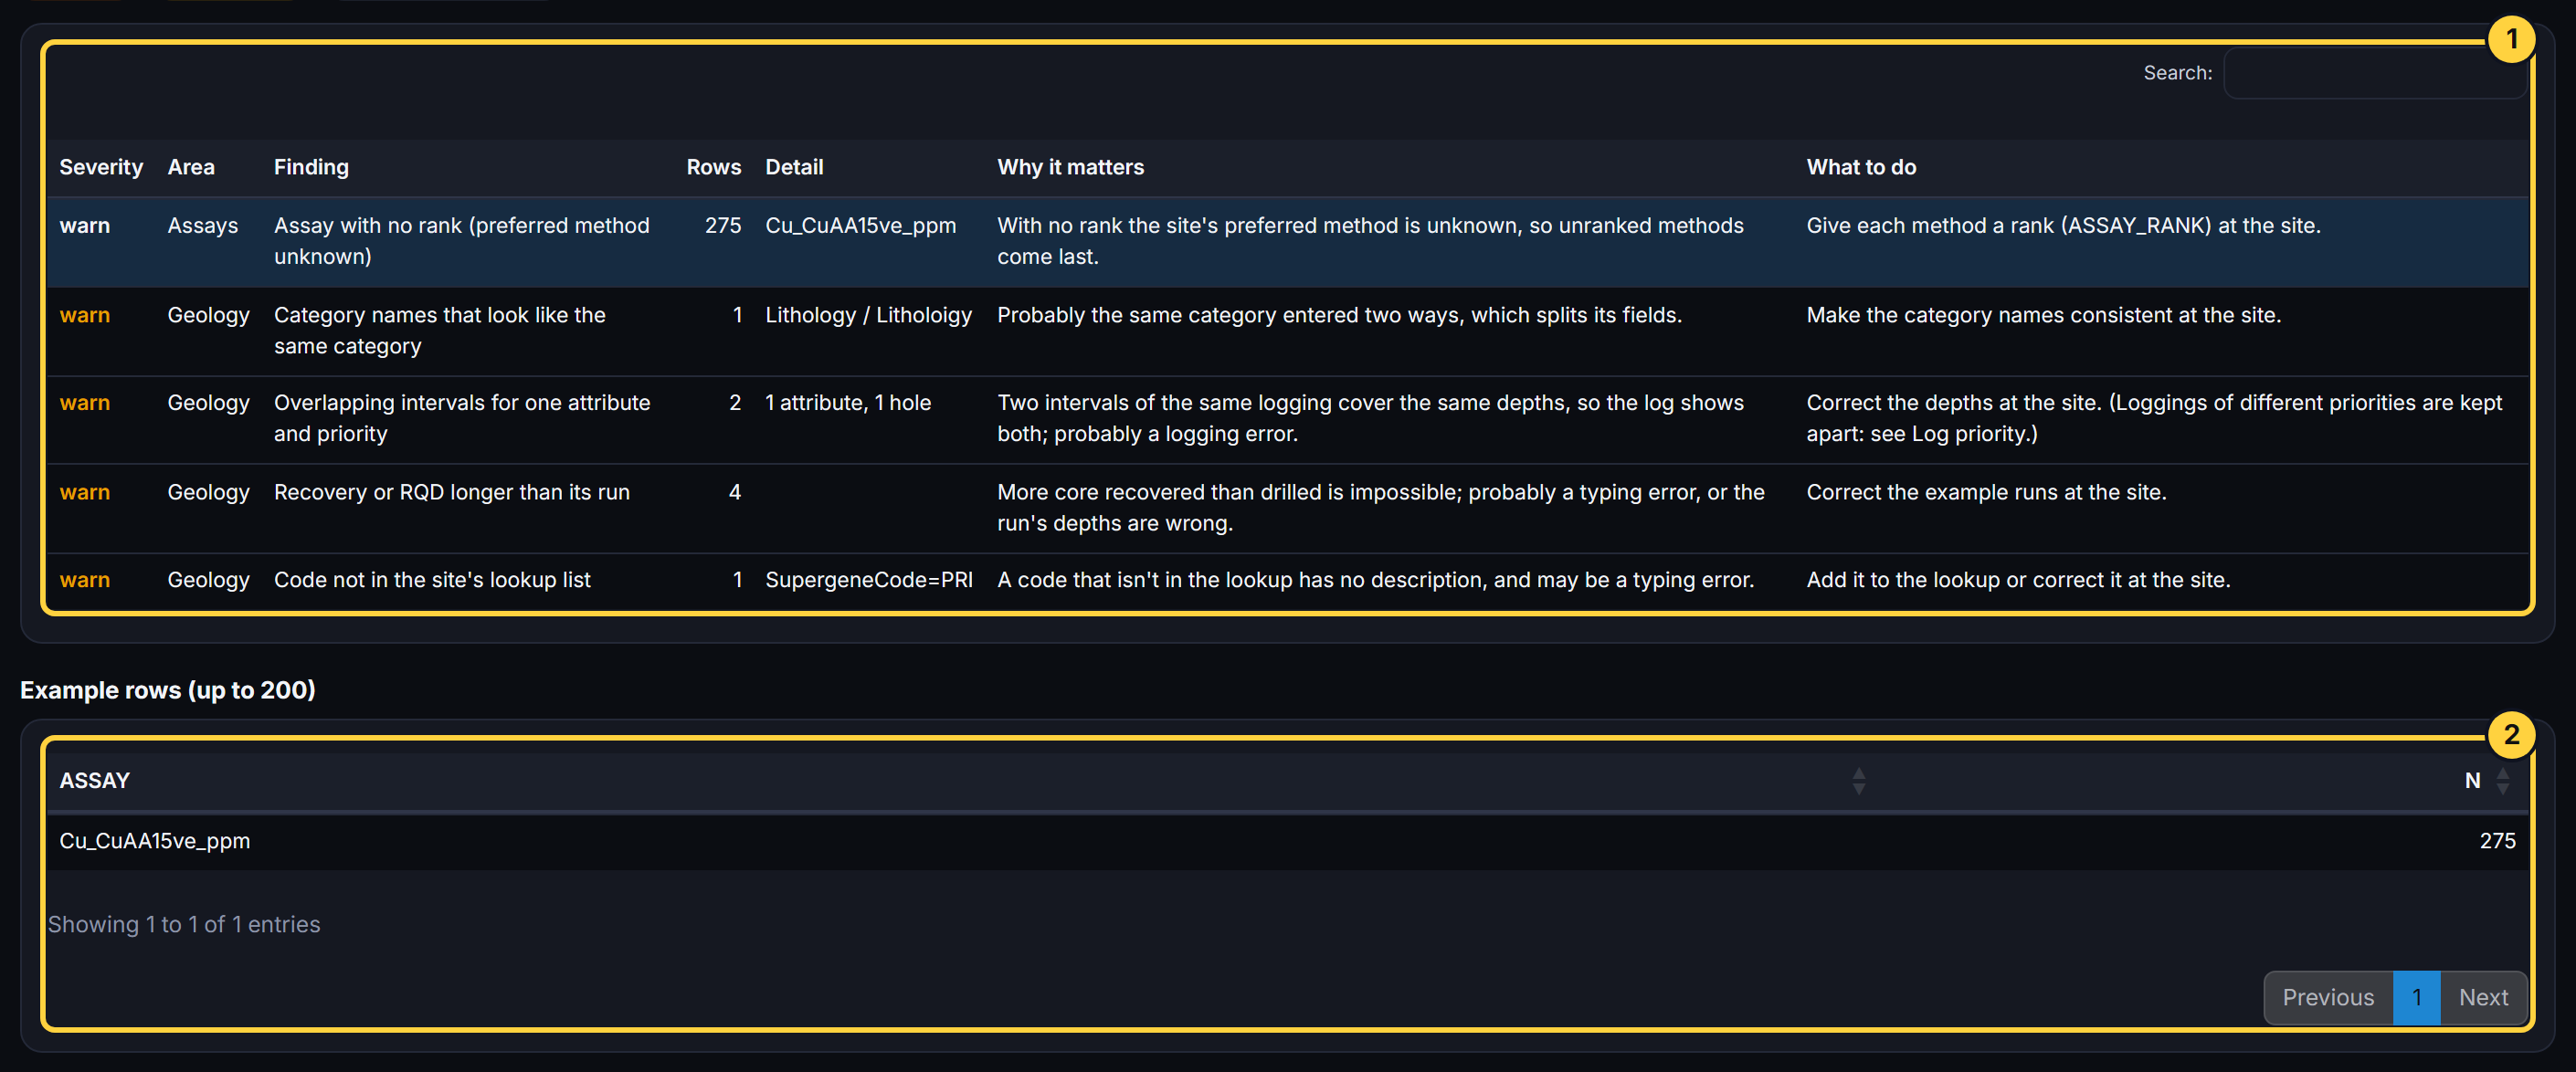
The table lists them worst first. Each row has the Area (sheets, collar, survey, geology, assays, QC, coordinates), the Finding, how many Rows it affects, a Detail, Why it matters and What to do. Select a row to see up to 200 of the rows behind it.
Example: the demo has 0 to fix, 9 to check and 28 for information. Among the nine to check: “Category names that look like the same category” (Lithology / Litholoigy, a typing slip at the site), “Grid name and projection zone disagree” (a grid called UTM50S whose projection says UTM zone 48N), and “Recovery or RQD longer than its run” (4 runs).
2. The checks, and why they exist
Sheets and columns
The workbook should have eleven sheets: Collar, HoleDetails, Survey, Geology, SampleIntervals, Assays, QCDuplicates, QCStandardsBlanks, Grids, GridPickup and HoleCoords (see Input format). They are recognised by their columns, so a renamed sheet is still found, and the app says so.
| Finding | Why it matters |
|---|---|
| View missing; required column missing | Part of the log can’t be drawn. |
| Number or date stored in a text column; text in a number column | Usually paste damage: a spreadsheet changed the cell’s type, for example turning hole 000123 into 123. |
| Date not readable; date in the future | A typing slip or a wrong date format. |
Holes, depths and coverage
| Finding | Why it matters |
|---|---|
| Duplicate hole in the collar sheet | Two collars for one hole: which is right? |
| Hole not in the collar sheet | Data for a hole the workbook doesn’t define. If removing leading zeros makes it match, the IDs were damaged by a spreadsheet. |
| Interval or station deeper than the hole | The hole was deepened and the collar depth not updated, or a depth was typed wrongly. |
| FROM greater than TO | An interval upside down: it can’t be drawn. |
| Hole with no depth | The log runs to the deepest data instead. |
Survey
The survey gives the hole’s path. Errors here put every depth in the wrong place in space.
| Finding | Why it matters |
|---|---|
| Stored grid azimuth looks 180° out | The stored azimuth is the back-bearing of the logged one: the hole points the wrong way. |
| Logged and calculated azimuth disagree; azimuth not on the collar’s grid | Azimuths must be on the same grid as the collar. |
| Dip sign convention inferred; dip changes sign within a hole | Some sites record down as negative, others as positive. A hole that changes sign has a typing error. |
| Two stations at the same depth; sudden change between stations (azimuth > 20° or dip > 10°) | A repeated or mistyped station bends the hole where it didn’t bend. |
Geology
| Finding | Why it matters |
|---|---|
| Overlapping intervals for one attribute and priority | Two rock types at one depth: the log can’t say which. |
| Category names that look like the same category | For example “Litholoigy” beside “Lithology”: a typing slip splits one category in two. |
| Angle outside its possible range | Alpha must be 0 to 90 and beta 0 to 360. |
| Recovery or RQD longer than its run; percentage outside 0-100 | Impossible values, usually a wrong field or a typing slip. |
| Code not in the site’s lookup list | A code no one defined, so it has no description. |
Assays and QC
| Finding | Why it matters |
|---|---|
| Sample and element with only pending or failed results | These are shaded on the log and don’t count as grade in intercepts. |
| Below-detection results; negative values | How the site stores results below the detection limit. Only results marked < are treated as below detection. |
| Element reported in more than one unit | The app converts them; check the unit on each column. |
| Assay with no rank; several methods sharing a rank | The app can’t tell which method the site prefers, so the latest load wins. |
| Sample depths differ between Assays and SampleIntervals | The same sample in two places. |
| Duplicates, standards and blanks | Summaries of the QC samples sent with the assays. Standards with no certified value can’t be judged. |
Why QC matters: a laboratory checks its own work with duplicates (the same sample assayed twice), standards (material of known grade) and blanks (material with none). A batch that fails these checks is not trusted, and the log shows its results shaded.
Grids and coordinates
| Finding | Why it matters |
|---|---|
| Grid name and projection zone disagree | A grid called “zone 50” with a projection in zone 48 puts holes hundreds of kilometres out. |
| Local grid with no pickup points | A mine grid can’t be converted without points known in both grids. |
| Collar more than 10 m from another of its coordinate sets | Often planned against surveyed positions, which is expected; otherwise one is wrong. |
3. The Data tab
Sheet chooses any sheet of the workbook. The table shows it as the app read it: numbers as numbers, dates as dates, IDs as text. Type in a box above a column to filter it.
Why: when a finding or a log looks wrong, find the row here and check the value at its source. For example, filter the Geology sheet by HOLEID and ATTRIBUTE to see every interval behind a lithology column.
Exercises
- Read a finding. In the demo, find “Category names that look like the same category”. Select it: which two names are they? What would you ask the database administrator to do?
- Overlaps. Find “Overlapping intervals for one attribute and priority”. Which hole is it? Open that hole on the Log tab and find the overlap. What does the log show there?
- RQD. Find “Recovery or RQD longer than its run”. Look at one of its rows on the Data tab (Geology sheet). Is it more likely a typing slip or a wrong field?
- Your own workbook. Load a workbook from your own project. How many findings are there to fix? Pick one to check and follow its “What to do”.