Student guide: Template and print
A strip log is usually handed in, filed or published as a printed page. Print turns the log on screen into a PDF at a true scale; the Template decides how it is laid out. One template drives both the screen and the PDF, so what you arrange on screen is what prints.
1. The template
Open Template: layout and print on the Log tab, under the columns.
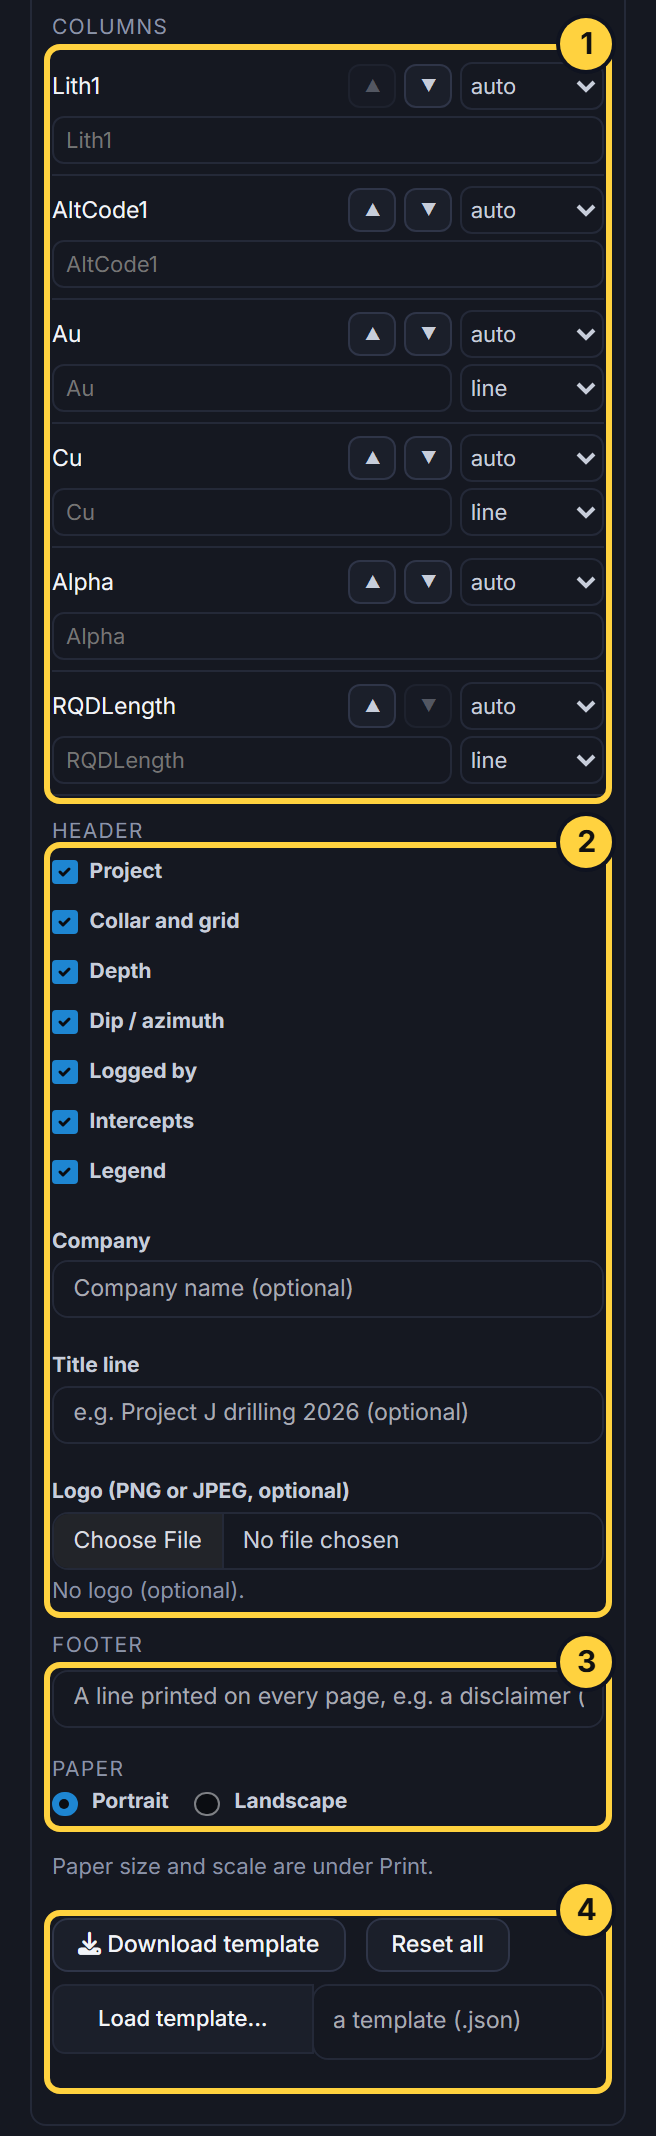
Columns
Every column you chose is listed, in the order it is drawn. For each:
| Control | What it does |
|---|---|
| ▲ ▼ | Moves the column left or right. |
| Width | auto, narrow, normal or wide. Auto gives a coded column with names more room, and shares the rest between the value columns. |
| Style (value columns) | line, line + fill (the area under the line shaded) or bars (each interval a filled bar). |
| Heading | Your own heading, for example “Gold (ppm)” instead of “Au”. |
Why styles: a line shows how a value changes down the hole. Fill and bars make high values stand out at a glance, which suits grades; a line suits a continuous reading such as magnetic susceptibility.
Header
Tick what the PDF’s header shows: Project, Collar and grid, Depth, Dip / azimuth, Logged by, Intercepts and Legend. Legend also hides or shows the legend under the log on screen.
Company and Title line are printed at the top of page 1 and shown above the log on screen. Logo adds a small PNG or JPEG picture (it is shrunk to fit, up to 400 KB).
Saving a template
Download template saves the layout as a file. Load template… reads one back, here or on another computer, so a class or a team can print identical logs. If a template has something this version can’t use, the app loads the rest and lists what it skipped. This browser also remembers the last template; Reset all puts the default back.
2. Print
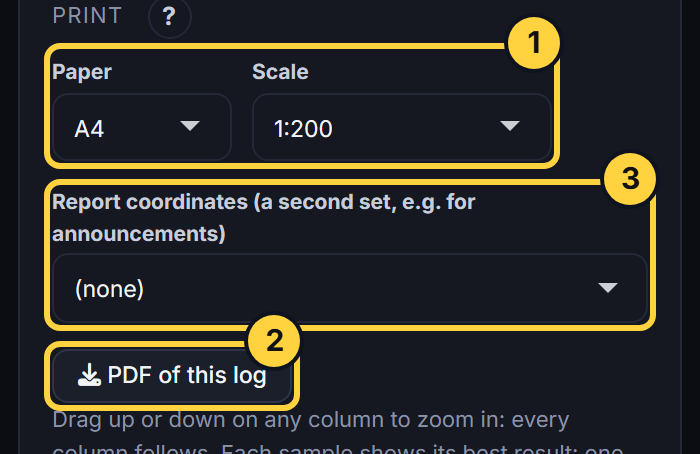
| Control | Choices | What it does |
|---|---|---|
| Paper | A4 (default), A3, Letter | The page size. |
| Scale | 1:100, 1:200 (default), 1:500, 1:1000, Fit to one page | How many metres of hole fit on a page. |
| Report coordinates | (none), or a coordinate set in the workbook | A second set of collar coordinates for the header and the intercept table. |
| PDF of this log | Makes the PDF. |
Scale
At 1:200, 1 mm on the page is 200 mm (0.2 m) of hole, so 1 m of hole is 5 mm of paper. The hole runs over as many pages as it needs; page 1 has the full header and later pages name the hole.
Example: at 1:200, 1 m of hole takes 5 mm of paper, so J-000026 (238 m) needs about 1.2 m of log and runs over several A4 pages. At 1:500 it takes 2 mm per metre, under half the length.
Why a true scale: logs drawn at the same scale can be laid side by side, or against a cross-section, and compared directly. Fit to one page is for a quick look; its footer gives the approximate scale.
What is on the PDF
- The header (as ticked in the template), with the first intercepts.
- Every column, with its heading and axis.
- A legend band on every page: each coded column’s codes, colours and patterns, the structure types, and the value columns. If the page is too narrow for all of it, the note names what was left out (it is still on screen).
- The end of the hole, marked with its depth.
- A footer on every page: the app and version, the workbook, the scale and depth range, the page number, your footer line, and how the results were chosen (which assay result is shown, the below-detection rule, what the shading means, and when the PDF was made).
Report coordinates
A company often reports collars in a different coordinate set from the one the database uses, for example a national grid instead of a mine grid. Report coordinates adds that set: under the hole on screen, in the PDF header (when Collar and grid is ticked) and as extra columns in the every-hole intercept table. The sets come from the HoleCoords sheet; the demo has UTM50S_Plan (the planned collar) and UTM50S_Surv (the surveyed one).
Exercises
- Scale. Print the same hole at 1:200 and 1:500. How many pages does each take? Which would you use to compare it with a 1:500 cross-section?
- A log for a report. Make a template with only lithology, Au and the intercepts; a heading “Gold (ppm)”; Au drawn as bars; a company name and a footer saying “Draft”. Download it, Reset all, and load it back. Did everything return?
- Landscape. Add four More columns and print in portrait, then landscape. What happens to the column widths and the legend?
- Report coordinates. Choose a report coordinate set and download the every-hole intercept table. Which columns were added, and why might they differ from the collar’s own coordinates?