Student guide: Log
The Log tab draws one drillhole: a column for each field you choose, all on one depth scale, with the hole’s header above and a legend below. The left panel chooses what is drawn and how; this page goes through it from top to bottom.
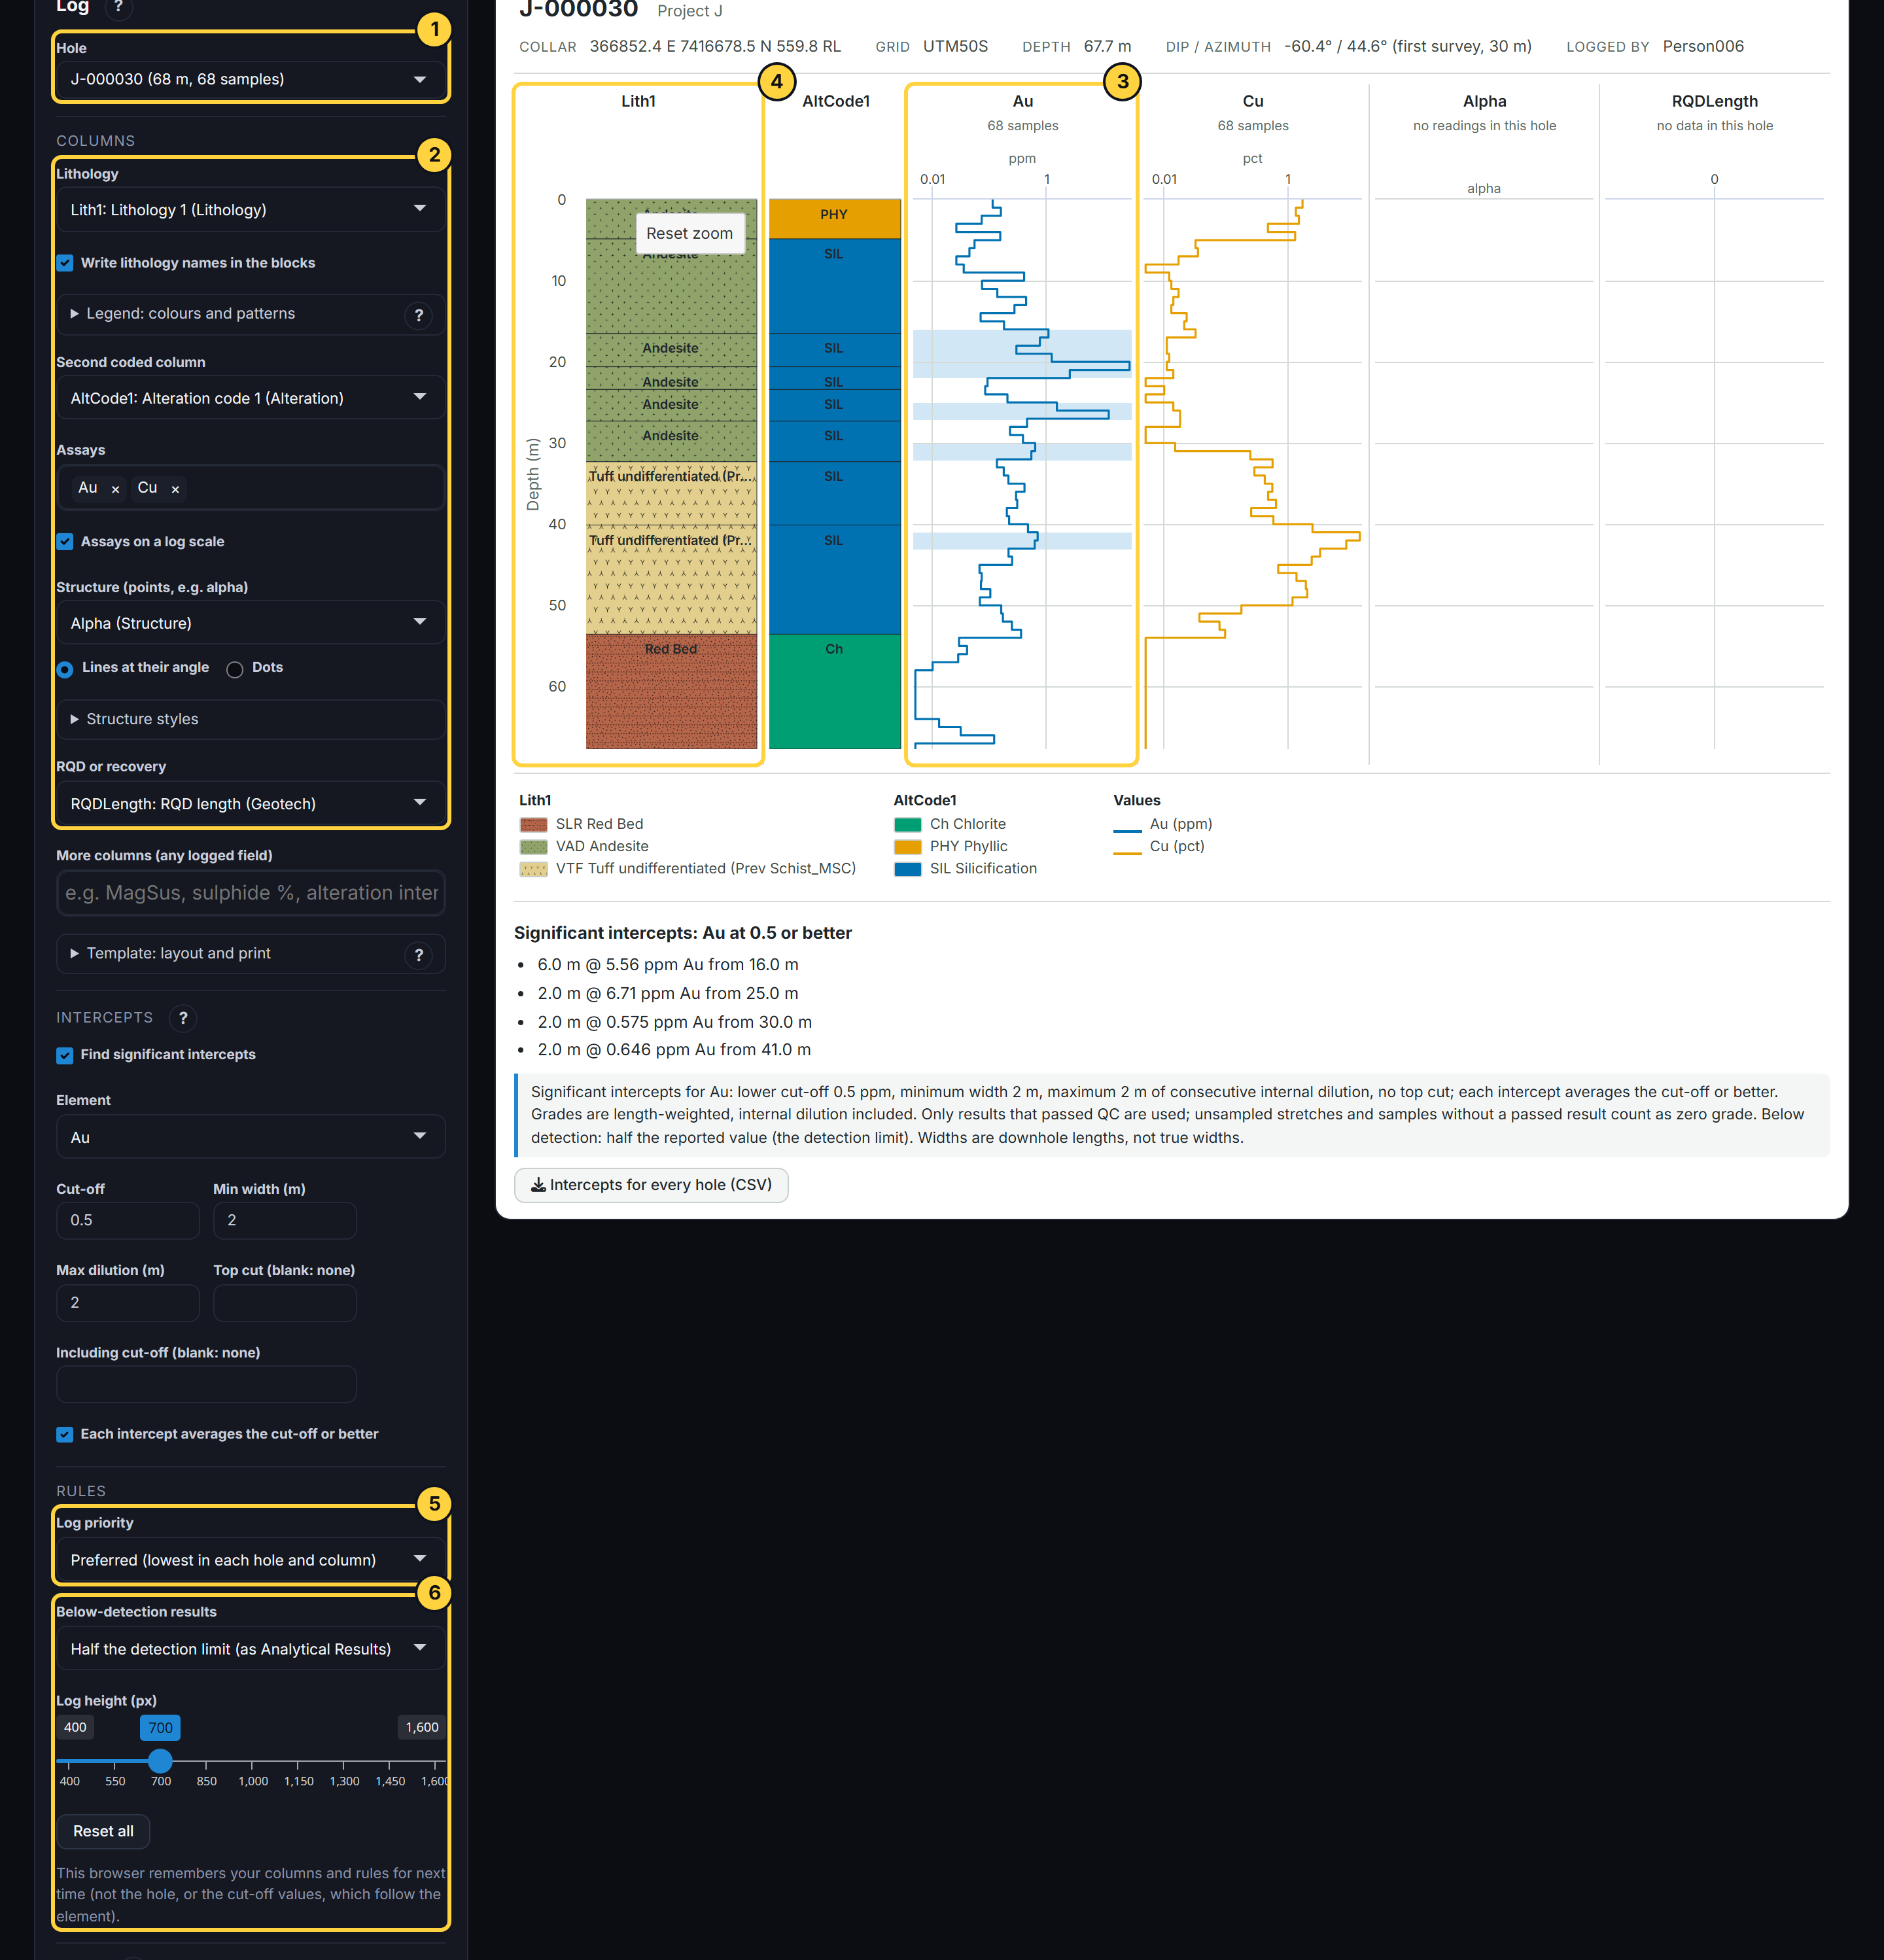
1. Hole
Hole lists every hole in the Collar sheet, with its depth and number of samples, for example J-000026 (238 m, 238 samples). The holes with the most assayed samples come first, so the best-sampled hole is drawn when you load a workbook. A hole with no geology says so.
The header above the log gives:
| Item | What it is | Where it comes from |
|---|---|---|
| Collar | The collar’s east, north and RL (elevation). | Collar sheet. |
| Grid | The coordinate grid of those numbers. | Collar sheet. |
| Depth | The hole’s total depth. “Not recorded” means the collar has none; the log then runs to the deepest logged or sampled depth. | Collar sheet. |
| Dip / azimuth | The hole’s orientation at its first survey station, and that station’s depth. | Survey sheet. |
| Logged by | Who logged the hole. | HoleDetails sheet. |
Example: for J-000030 the header reads Collar 366852.4 E 7416678.5 N 559.8 RL, Grid UTM50S, Depth 67.7 m, Dip / azimuth -60.4° / 44.6° (first survey, 30 m), Logged by Person006. The dip is negative because this site records downward as negative (Data health says which convention it found).
Why the first survey: a hole bends as it is drilled, so its dip and azimuth change with depth. The header gives the orientation near the top, where the hole starts; Data health warns when the survey changes suddenly between stations.
2. Columns
Each choice adds a column (a track) to the log. Every track shares the depth axis, so a lithology contact, an alteration change and a jump in gold line up across the page.
Lithology
Lithology chooses the field that holds the rock type. The app guesses it from the field names (a lithology category with a “lith” or “rock” field) and picks the one logged in the most holes.
Each interval is a block in the rock type’s colour, with its FGDC pattern over it (the US geologic map standard: dots for sandstone, Vs for tuff, crosses for granite …). The colour and pattern are guessed from the code’s description; see Legend: colours and patterns.
Write lithology names in the blocks writes each rock’s name (its description) in its block; untick it to write the short code instead. A name too long for a thin block is shortened with “…”.
Example: in the demo, Lith1 has 13 codes. Andesite (VAD) is drawn olive green with pattern 721, Tuff undifferentiated (VTF) pale yellow with the tuff pattern 711, and Red Bed (SLR) brick red with pattern 608. On J-000030 the tuff’s long name, “Tuff undifferentiated (Prev Schist_MSC)”, is shortened in its blocks.
Why patterns as well as colours: colours alone fail when the log is printed in black and white or read by someone with colour-blind vision. Patterns are the long-standing convention on geological logs and maps.
Second coded column
Second coded column adds another logged code, usually alteration or weathering. Its blocks are coloured but have no pattern.
When the codes describe a strength (none, weak, moderate, strong, intense), or the field is an intensity such as AltInt1 holding the numbers 0 to 5, the app colours them on a ramp from pale (none) to dark red (intense), so stronger is always darker:
| Rank | Words that set it |
|---|---|
| 0 (palest) | none, nil, absent, fresh, unaltered |
| 1 | trace, weak, slight, minor, low, faint |
| 2 | moderate, medium |
| 3 | strong, high, deep, heavy |
| 4 (darkest) | intense, extreme, complete, pervasive |
Other codes get distinct colours from a colour-blind-safe palette.
Example: the demo’s alteration intensity AltInt1 holds the numbers 2 to 5, with no words. The field’s name says it is an intensity, so the app puts the numbers on the ramp: 5 is drawn darkest. Add it under More columns on hole J-000061 to see it.
Assays
Assays adds a column for each element you choose (up to 10). The app starts with Au and Cu if the workbook has them. Each sample interval is drawn as a step at its value.
Assays on a log scale (on by default) spaces the axis by powers of ten: 0.01, 0.1, 1, 10. Grades span several orders of magnitude, and on a straight scale one high-grade sample flattens everything else against the axis. Values of zero or less can’t be drawn on a log scale and are left off it.
Which result is shown
A sample can have several results for one element: a repeat, a second method, a batch that failed QC. The app shows one result per sample, chosen in this order:
- The best QC status. A result that passed QC (PRIORITY 1 in the database) comes first. If there is none, a pending result (PRIORITY 2), then a failed one (3 or more).
- The site’s preferred method (the lowest ASSAY_RANK). A method with no rank comes last.
- The latest load, if two are still tied.
A sample whose shown result did not pass QC is shaded: amber for pending, red for failed. Results in other units are converted to the unit used most in that hole (ppb to ppm, % to ppm and so on).
Why: a geologist reading a log must know whether a number can be trusted. Shading a failed or pending result, rather than hiding it, shows both the value and its doubt.
Example: in the demo, every one of the 20,610 assay results passed QC, so nothing is shaded. Data health says so (“QC status of results: PASS 20610”). On your own data, a pending or failed batch shows at once.
Structure
Structure (points, e.g. alpha) chooses the angle field of oriented-core structures, such as Alpha. The app finds the structure type and the beta angle logged beside it.
The radio buttons choose how each reading is drawn:
| Choice | What you see | Use it for |
|---|---|---|
| Lines at their angle (default) | A short line through the reading’s depth, at its alpha angle to the core axis: 90° is straight across the core, 0° runs along it. The line leans left when beta is between 0° and 180°, right otherwise. The angle is written beside it. | Seeing structures as they look in the core tray. |
| Dots | A dot at the reading’s depth, placed across the column by its alpha (0 to 90). | Seeing how alpha changes with depth. |
Alpha and beta: alpha is the acute angle between a plane (a vein, a joint, bedding) and the core axis. Beta is measured round the core from a reference line, and says which way the plane dips in the core. A line drawn at alpha and leaning by beta is the trace you would see on the side of the core.
Structure styles colours each structure type and gives it a line style, guessed from its name:
| Type contains | Colour | Line |
|---|---|---|
| fault, shear, gouge, mylonite | black | dashed |
| vein | orange | solid |
| contact, boundary | grey | dotted |
| bedding, lamina, banding, layer | blue | solid |
| foliation, cleavage, schistosity | green | solid |
| breccia | pink | dash-dot |
| joint, fracture | light blue | solid |
| anything else | dark grey | solid |
Structure legend (CSV) downloads these; change a COLOUR (#RRGGBB) or LINE (solid, dashed, dotted, dotdash) and load the file back with Load styles….
Example: hole J-000061 has 12 structure readings: 6 foliations (green), 5 joints (light blue) and 1 lithological contact (grey, dotted). The foliation at 19.90 m has alpha 25° and beta 39°, so its line runs close to the core axis and leans left; the joint at 31.24 m has alpha 35° and beta 333°, so it leans right. Six readings lean each way.
RQD or recovery
RQD or recovery adds a rock-quality column. RQD (rock quality designation) is the percentage of a run made up of pieces of core 10 cm or longer. Recovery is the percentage of the run that came back as core. A field given as a length (RQD in metres) is turned into a percentage of its run; a field given as a percentage is drawn as it is.
Why: low RQD or recovery marks broken ground: faults, weathering, poor drilling. It also warns that assays in that stretch came from less core.
More columns
More columns (any logged field) adds any other field in the Geology sheet, as many as you like: magnetic susceptibility, a sulphide percentage, another alteration code. Codes are drawn as coloured blocks (an intensity on the ramp above); numbers as a line, or as joined readings when they were logged at points.
Example: on hole J-000061, add AltInt1 (alteration intensity, on the ramp), SuPct1 (sulphide percentage, a line from 0 to 100 %) and MagsusReading1 (magnetic susceptibility, logged at points).
3. The log itself
- Zoom: drag up or down on any column. Every column follows. Reset zoom (on the first column) shows the whole hole.
- Hover over anything to see its value and depth.
- The legend under the log has a block for every coded column (code, colour, pattern, name), the structure types, and the value columns.
- Blue shading on an assay column marks the significant intercepts (see the Intercepts guide).
4. Rules
Log priority
A hole is sometimes logged more than once: the first logging, then a relog by another geologist. The database gives each logging a PRIORITY; the lowest is the site’s preferred one.
Log priority chooses which logging is drawn:
| Choice | What is drawn |
|---|---|
| Preferred (lowest in each hole and column) | For each column, the lowest priority that column has in this hole. |
| 1, 2 … | Only that logging. A column without it says “No priority N log in this hole”. |
Loggings are never mixed in one column, because two geologists’ intervals overlap and disagree. Different columns can come from different loggings: lithology from the relog, RQD from the first.
Example: the demo was logged once, so the picker offers only Preferred and 1, and both draw the same log. Relogged holes are common in older projects; Data health flags overlapping intervals at one priority.
Below-detection results
A laboratory reports a result below its detection limit as, say, “<0.01”. The database marks it with < and usually stores the limit as the value.
| Choice | Value used |
|---|---|
| Half the detection limit (as Analytical Results) (default) | Half the stored value: a <0.01 result counts as 0.005. |
| As written | The stored value: 0.01. |
Why half: the true value is somewhere between zero and the limit. Half is the usual convention; it neither inflates a grade (as the full limit would) nor treats the sample as barren (as zero would). Only results marked < count as below detection. Some databases store them as negative numbers instead; Data health reports those.
Example: the demo has 5,488 below-detection results, 7 of them gold results in J-000030. Switching to As written changes none of J-000030’s intercepts: those samples are far below the 0.5 ppm cut-off either way. It matters more where the detection limit is close to the cut-off.
Log height and Reset all
Log height (px) makes the log taller (to read a long hole) or shorter (to see it all at once).
This browser remembers your columns and rules for next time. Reset all puts every setting back to the default and forgets them.
Exercises
- Gold and rock type. On hole J-000030, which lithology hosts the highest Au values? Is it the same rock in hole J-000005?
- Log scale. Untick Assays on a log scale. What happens to the low Au values? Which scale would you use to show a cut-off of 0.5 ppm, and why?
- Structures. On J-000061, find a structure close to 90°. Is it nearly across the core? Switch to Dots: where does that reading sit?
- Below detection. Switch Below-detection results to As written. Does any intercept change? Why would it change more in a hole with many below-detection samples?
- RQD from a length. On J-000017, the first RQD run is 0.0 to 1.2 m with 0.55 m of core in pieces over 10 cm. What percentage should the column show? (0.55 / 1.2 = 45.8 %.) Hover to check.