A Robust Approach to the Thompson Howarth Chart for the Estimation of Analytical Precision in Mining & Exploration
Introduction
The Thompson-Howarth (TH) method of estimating analytical precision, first published in 1976 and summarised in 1978, has become a popular means of estimating analytical precision in some sectors of the resource industry. TH present two approaches, method 1 which is applicable where the number of data pairs is >50, and method 2 is applicable where the number of data pairs is <= 50. The focus of this article is on method 1.
The aim of this discussion is to demonstrate that by using a linear regression line based on robust statistics, the TH method 1 produces a more reliable estimate of precision.
Discussion
The fundamental assumption underpinning the TH method is that analytical errors follow a Gaussian (aka Normal) distribution. However, TH temper this with several examples where a Gaussian distribution may not apply and will unduly introduce bias. This includes nugget gold and the heterogeneity of the sample. For the former, there is an excellent discussion on the limitations of the TH approach by Stanley (2006). Geological variation is something I cover in a separate article (The Impact of Geological Variation when Quality Controlling Precision). Be mindful of this, a duplicate is not a duplicate in the sense for required for assessing precision.
The steps for their method are:
- Compute the absolute difference of each pair
- Compute the mean of each pair
- Order by mean of the pairs
- Starting with the lowest concentrations, partition the mean of pairs (and their corresponding absolute differences) into groups of 11
- Compute the median of the absolute differences and mean of mean pairs within each partition
- Chart each point
- Regress the median of the absolute differences onto the mean of mean pairs.
- The intercept and slope of the regression line can be used to compute precision for different concentrations and the practical detection level (PDL) providing there are enough values at close to the detection limit.
Let’s look at a typical presentation (in this case for iron ore):
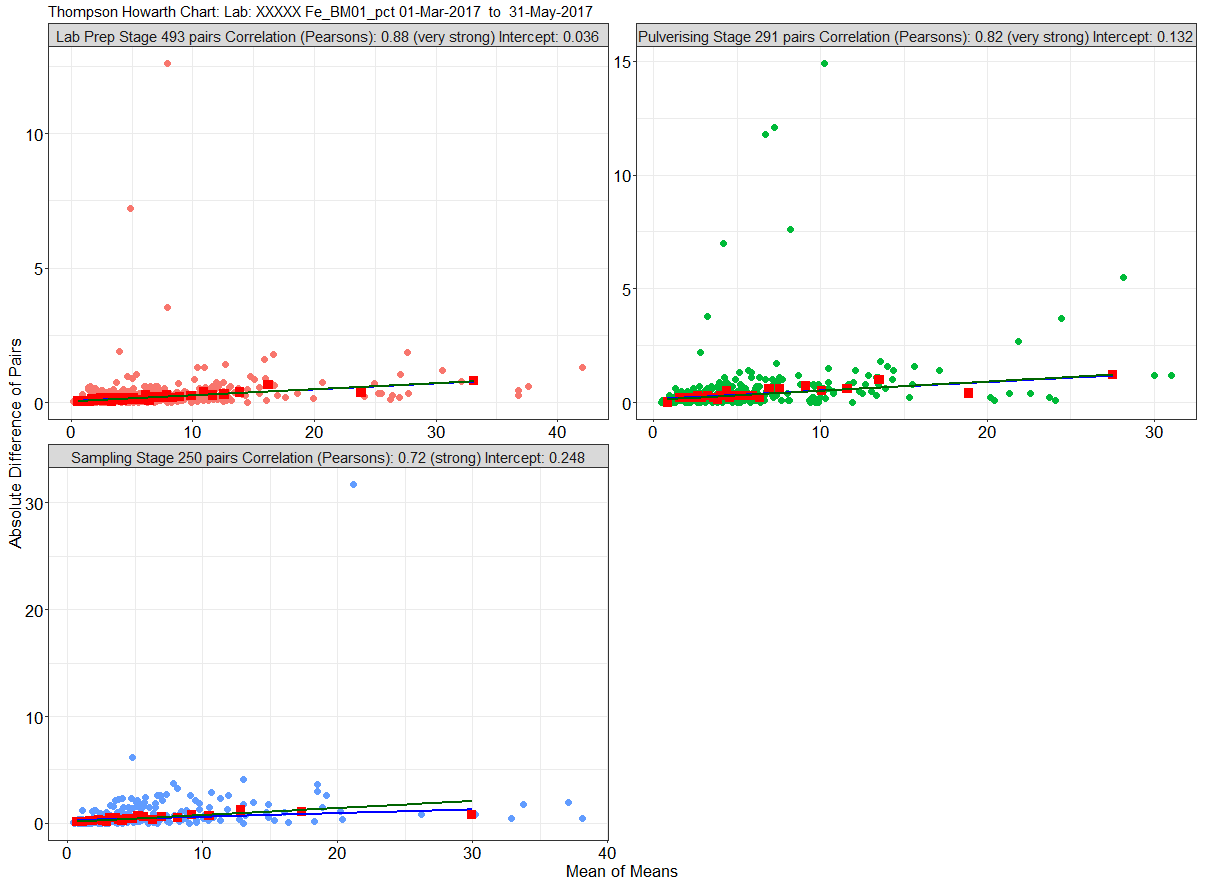
- Larger square red symbol: Computed partitioned value (step 5)
- Smaller circles: Raw paired values, colour coded according Sampling stage (Step 1 and 2)
- Blue straight line: Ordinary least squares regression (OLS) (Step 7)
- Green straight line: Robust least squares regression (RLS) (Step 7)
- The correlation coefficient and intercept shown in the title for each chart is based on OLS
If there are large ranges in concentrations, a log-log plot is used (I have completed a log transform of the regression lines, to maintain linearity):
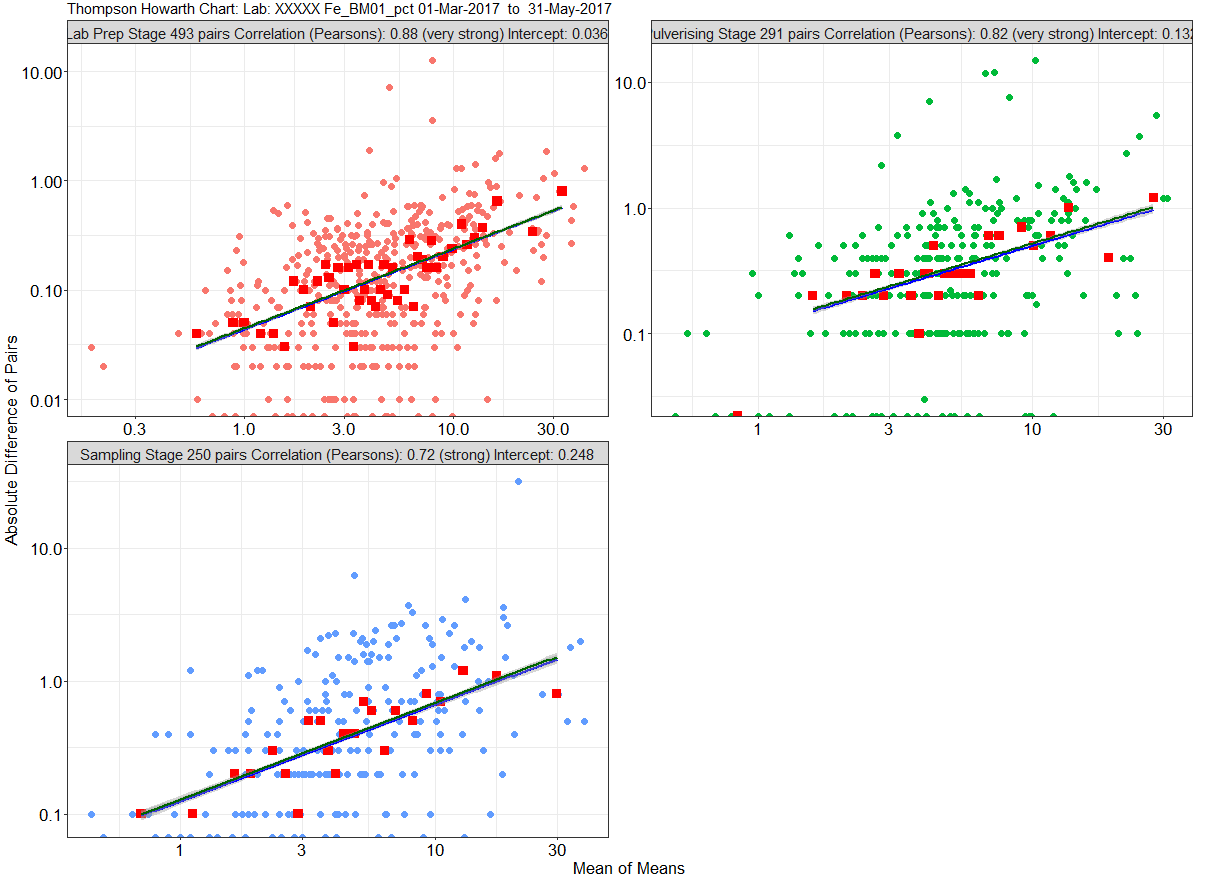
Many will compute an ordinary least squares regression line. However, the fundamental statistic for this is the mean and the mean is influenced by outliers. Just one outlier can materially affect the mean and therefore influence the slope (and intercept) of the regression line. I discuss this in more detail in another article (Robust Least Squares Regression: A ‘Best Fit’ Line Resistant to Outliers).
For brevity I will focus on Sampling Stage (field duplicate). I have hidden the raw pairs:
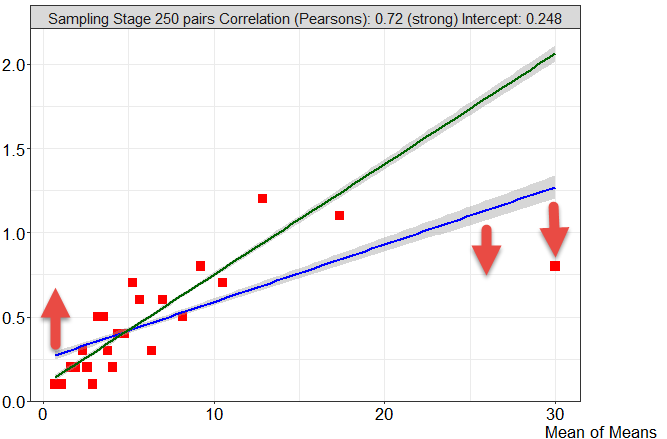
The OLS line is being influenced and therefore pulled down by the point to the right. Because of this, the OLS has produced a high intercept. Here is a TH precision v concentration chart based on the OLS statistics:
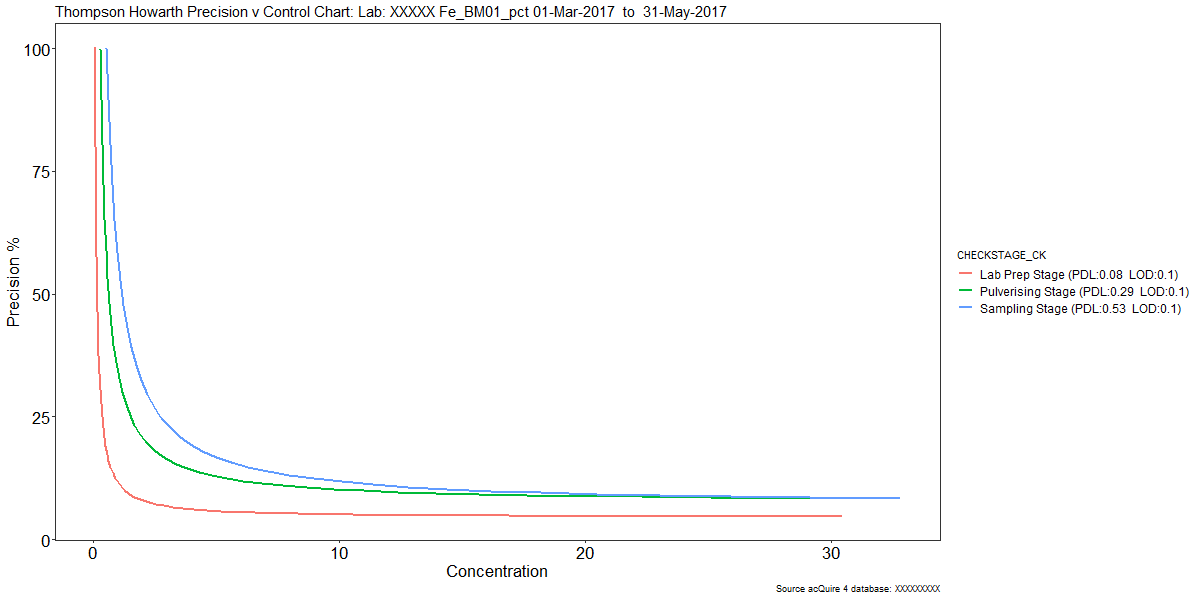
Two comments:
- Sampling stage (field duplicate) precision at high concentrations appears to be the similar to Pulverising stage (in the laboratory).
- Practical detection limits are quite large compared to the reported lowest level of detection.
Looking at the data in another way:
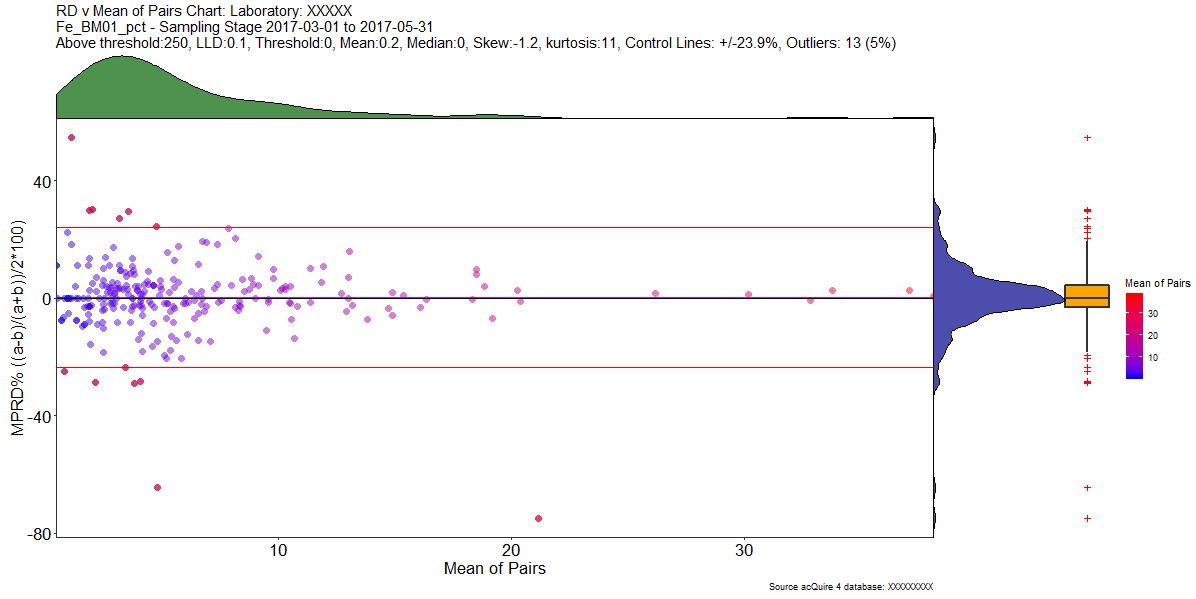
Control lines are derived using statistical quality control techniques, which I cover in a separate article (QC Analytical Results Precision: Identifying Outliers. A Statistical Approach). I could exclude the outliers, but for this article, I will leave as is.
Reverting to the previous TH chart, the RLS regression line is not influenced by the one outlier identified because the fundamental statistic underpinning robust statistics is the median. The data would need to have more than 50 percent of values to be outliers before breakdown. For this reason, the median is a robust statistic. It is resistant to the influence of outliers. Here is the same chart with intercept computed using RLS (displayed in the title):
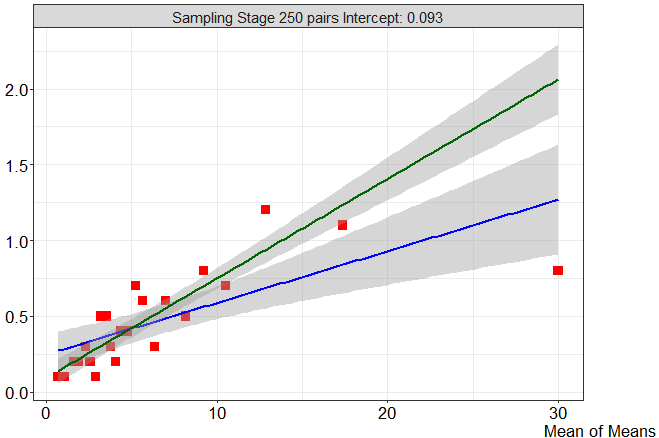
The intercept is much lower than that produced by OLS. Here is the Precision v Concentration chart based on RLS statistics:
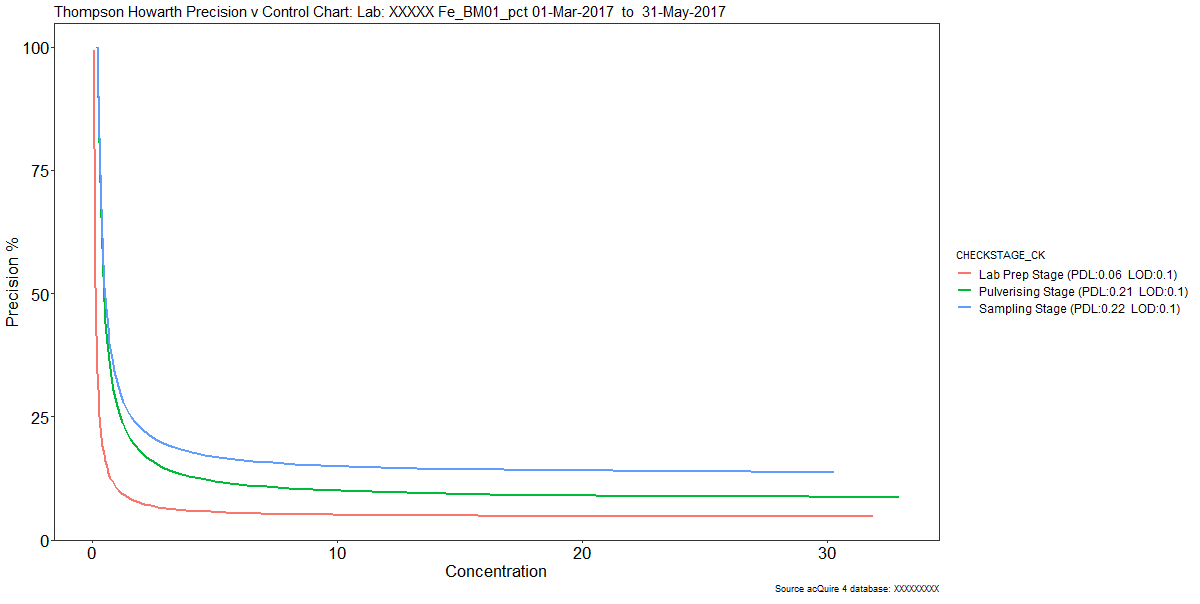
PDL is now much closer than the reported detection limit by the laboratory, compared to that computed from OLS. Moreover, the relationship of the curves more properly reflects what we might expect for the various sampling stages.
Finally, the choice of partition window is arbitrary. TH suggest 11, however, this could be increased for larger datasets. The larger the window, the less the potential influence of outliers. Below I used a partition of 15. Notice OLS and RLS sit close together:
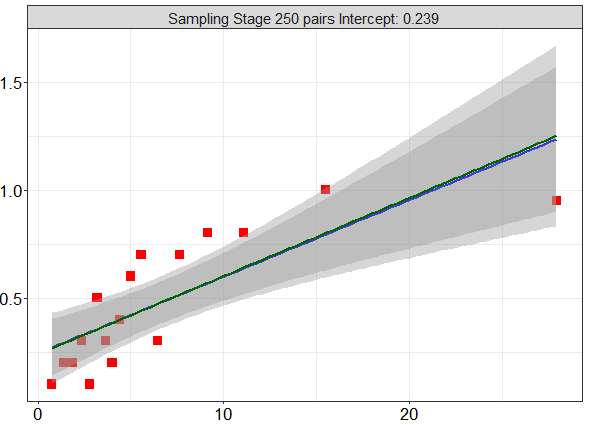
Wider partition, less points, but better correlation.
Conclusion
In this article, I hope I have demonstrated that the use of a robust statistics to compute the regression line in the TH method 1 is more reliable because of its resistance to the influence of outliers. An RLS line is more likely to produce a realistic practical detection limit and precision at various concentrations.
However, it is always important to ensure that there is no undue bias in the source data due to geological variation or sampling, for example. In which case these need to be understood and investigated before the TH approach to estimating precision should even be considered. The fundamental assumption of TH is that measurement errors are normally distributed. However, where this is not the case, it may produce biased results.
Chart Source
All charts developed using the R programming language and ‘Shiny’. A cloud version is available to explore.
References
Stanley C. R. 2006. On the special application of Thompson–Howarth error analysis to geochemical variables exhibiting a nugget effect, Geochemistry: Exploration, Environment, Analysis, 4, 357-368. https://doi.org/10.1144/1467-7873/06-111
Thompson M., Howarth R. J. 1976. Duplicate Analysis in Geochemical Practice (Parts 1 and 2), Analyst. 101. 690-709.
Thompson M., Howarth R. J. 1978. A New Approach to the Estimation of Analytical Precision, Journal of Geochemical Exploration. 9. 23-30.
First published on LinkedIn, 9 September 2018. More on this topic: Duplicates.