Repeated median regression workbook
Download the workbook (Excel, 2 MB)
Excel 2010 or later. No macros. Licence: CC BY 4.0, free to use and share with credit to Geoscience Analytics.
What it shows
Paired results should fall on a straight line. Least squares is pulled by every pair in proportion to the square of its distance, so a single bad pair can swing it. The repeated median (Siegel, 1982) is not: nearly half the pairs can be wrong and the line still holds.
The workbook fits three lines to the same pairs and draws them on one chart:
- Repeated median. For each point, the median slope to every other point; then the median of those medians.
- Theil-Sen. The median of all the slopes at once. This is the robust best-fit line on the scatter and precision charts in QC Analytical Results. It usually agrees closely with the repeated median, but holds only while fewer than about 29% of the pairs are bad.
- Least squares, for comparison.
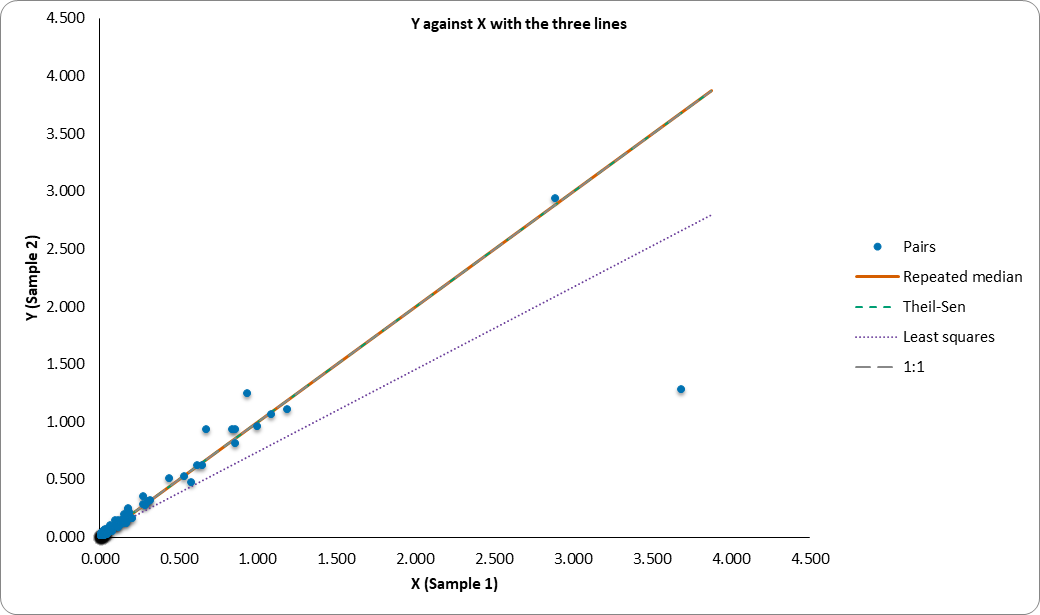
The example is 179 gold pulp repeats (g/t) from a real exploration programme, with the sample IDs removed. One pair, 3.69 against 1.28, pulls the least squares slope down to 0.71, while the repeated median and Theil-Sen stay at 1.00. Clear that pair (row 166 on the Data sheet) and least squares goes back to 1.03; the robust lines do not move.
The sheets
- README: the method step by step, why it uses two medians, and the sources.
- Data: your pairs (blue), with each point’s median slope beside it.
- Results: the three lines, their slopes and intercepts, R squared for least squares, and the chart.
- Slopes: the slope between every pair of points, one row per point, with each row’s median. A bad point stands out as a row whose median sits apart from the rest.
- Robust mean and SD: the robust mean and SD of each column by the method in AMC Technical Brief No 6, one row per iteration, so you can watch them settle.
Using your own pairs
- On the Data sheet, select B6:C505 and press Delete.
- Paste X into column B and Y into column C from row 6 down, one pair per row, with no gaps (Paste Special, Values). Up to 500 pairs.
- Read the Results sheet. With a few hundred pairs Excel may take a second or two to recalculate.
Pairs of points with the same X have no slope, so they are left out, as Siegel does. The Results sheet says how many there were.
Learn more
- A ‘Best Fit’ Line Resistant to Outliers when Assessing Precision, the article behind this workbook.
- Duplicates and precision, with the QC Analytical Results method pages.