Change-point analysis workbook
Download the workbook (Excel, 6 MB)
Excel 2010 or later. No macros. Licence: CC BY 4.0, free to use and share with credit to Geoscience Analytics.
What it shows
The Shewhart and CUSUM charts watch each new result as it arrives. This workbook looks back over a run of results and answers three questions: did the laboratory’s results shift, where, and how sure can you be? It needs no target, no SD and no control lines, and it does not assume the results are normally distributed.
It adds up each result’s difference from the mean of the run, in run order. With no change the running total wanders about zero. When the laboratory shifts, the total heads one way and then turns, and the turning point is where the change happened. To say how sure you can be, the workbook draws 1,000 new sets of results from the same run at random (a bootstrap), each with any change mixed away, and counts how many show a running total as large as the real one (Taylor, 2000).
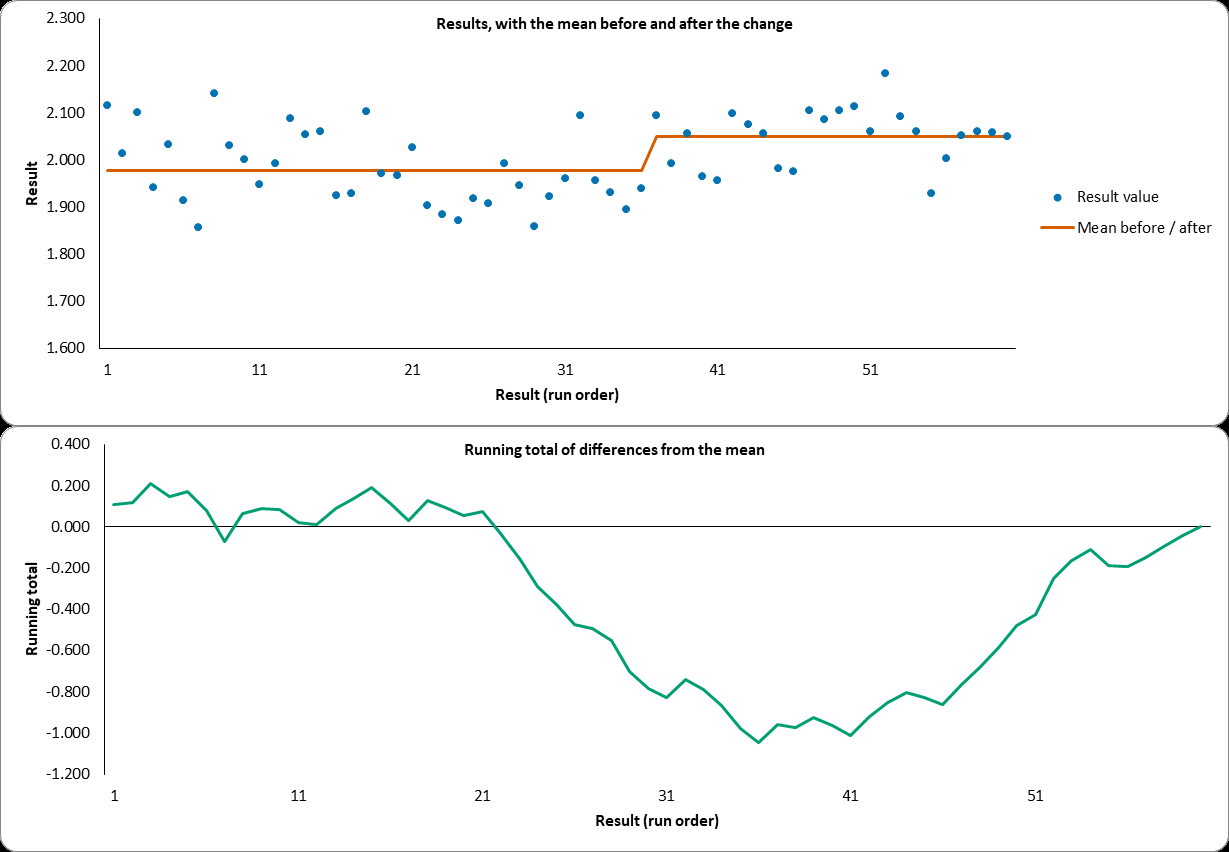
A run can hold more than one change, so you split it and look again. In the example, results 1 to 36 put a change after result 21, and results 37 to 60 after result 46: exactly where the shifts start, though with only 15 results to each shift the confidence is about 90%, short of the 95% that counts as a finding.
The sheets
- README: the method step by step, how to split a run, its limits and the sources.
- Data: your results in run order (blue), and the stretch to look at, From and To (yellow).
- Analysis: the answer, in a sentence, then one row per result with its difference from the mean and the running total.
- Charts: the results with the mean before and after the change, and the running total.
- Bootstrap: the 1,000 resamples. Press F9 to draw again; the confidence moves by a percent or so each time.
Using your own results
- On the Data sheet, select B6:B205 and press Delete.
- Paste one standard’s results for one element into column B from row 6 down, in run order, with no gaps (Paste Special, Values). Up to 200 results.
- Leave From at 1 and To empty for the whole run. Read the answer on the Analysis sheet.
- If it finds a change at 95% or more, set From and To to each side of it and look again.
It finds shifts in the mean, not changes in scatter, and it assumes each result is independent of the one before.
Learn more
- Shewhart and CUSUM workbook: the charts that watch each new result.
- Control charts for standards, with the QC Analytical Results method pages.