Shewhart and CUSUM workbook
One standard on a Shewhart chart with the eight Nelson rules and on a two-sided CUSUM, side by side. Paste in your own results.
Download the workbook (Excel, 140 KB)
Excel 2010 or later, or LibreOffice. No macros. Licence: CC BY 4.0, free to use and share with credit to Geoscience Analytics.
What it shows
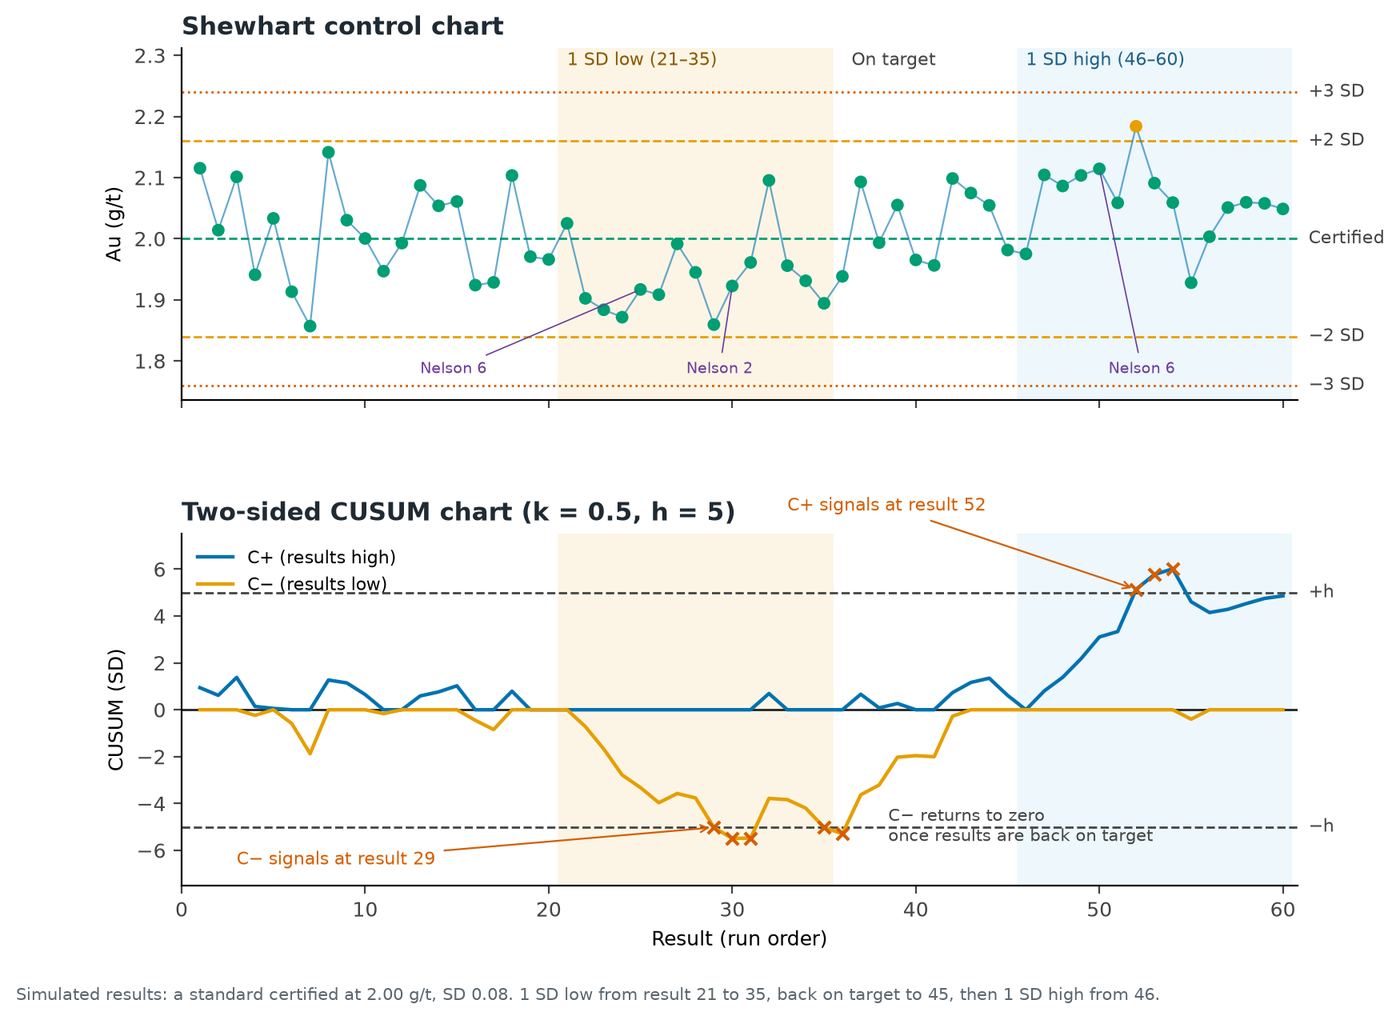
The workbook plots one standard (CRM) on a Shewhart control chart, with the eight Nelson rules, and on a two-sided CUSUM chart, one above the other on the same run order. You can see, result by result, how each chart reacts to the same data.
The sheets
- README: what the workbook does, every column explained, the eight Nelson rules, how to choose k and h, and the sources.
- Calculator: the inputs at the top (yellow cells), then one row per result: the z score, the Shewhart status, each Nelson rule, C+, C− and the CUSUM signal. Every calculated number is a formula.
- Charts: a summary of what the charts found, then the Shewhart chart and the CUSUM chart.
Using your own results
- On the Calculator sheet, set the target (certified value), the SD, k and h. Use the certified value and SD where the certificate gives them.
- Clear the example: select C10:C509 (and B10:B509 for the sample IDs) and press Delete.
- Paste the results for one standard and one element into column C from C10 down, in run order, with no gaps (Paste Special, Values). Up to 500 results.
- Read the Charts sheet. Both charts resize to the number of results.
Learn more
- Change-point analysis workbook: looks back over the same results and finds where they shifted, with a confidence.
- Control charts for standards, with the QC Analytical Results method pages.