The Application of Statistical Quality Control to Assessing Accuracy in Mining & Exploration
Introduction
This article is aimed at QAQC Geoscientists who may not have a theoretical background but need to be confident that the tools that they use have a sound statistical basis.
Quality control in our industry is fraught with many challenges. If you need a reminder, have a look at Game of Mines .
As a further example, we should be mindful of the impact of geological variation on precision .
The original intent of this article was to discuss a statistical approach to assessing the quality of analytical results, referred to as statistical quality control (SQC), one that has a long history in other industries such as manufacturing and distribution. However, it soon became apparent that the article would be much longer than I wished. The article has morphed into two:
- The Application of Statistical Quality Control to Assessing Accuracy of Analytical Results (This article).
- Identifying Outliers when Assessing Precision in Mining & Exploration.
Statistical Quality Control
It is beyond the scope to provide a detailed explanation of SQC in this article. For those interested, there is a wealth of material on the internet. As a start, I would refer you to:
- ‘Walter A Shewhart, 1924, and the Hawthorne factory’ and
- ‘6. Process or Product Monitoring and Control – Engineering Statistics Handbook - National Institute of Standards and Technology ’
The founder of SQC, Walter A. Shewart (1924), recognised that variation in a process can be divided into two fundamental components:
- Chance causes: Cumulative effect of many small, essentially unavoidable natural variability or background noise. These will always be present
- Assignable causes: Large variability or unacceptable level of process performance that arises from sampling/human error, wrongly calibrated instruments. These are avoidable. Identifying and minimising is essential.
SQC is the application of statistical techniques to measure and evaluate the quality of a product, service, or process. Control is managed through control charts. Charts have upper and lower control limits derived by statistical inspection of the sample population. The process is ‘in control’ if sample measurements are between the limits.
The underlying objective of SQC is to quickly detect the occurrence of assignable causes that induce a process to shift to an ‘out of control’ state, and therefore allow investigation of the process so that corrective action may be undertaken if necessary.
The control chart is a process-monitoring technique (widely used in manufacturing and other industries, for example) for this purpose. There are a number of control charts based on differing statistical approaches. From an accuracy perspective, in our industry, a common chart is the Shewhart control chart which charts analytical results for reference material (RM) . Control lines are usually based on the RM ‘certified’ value plus/minus RM ‘certified’ 2, 2.5 or 3 standard deviations (name of RM’s hidden for confidentiality purposes in the images below):
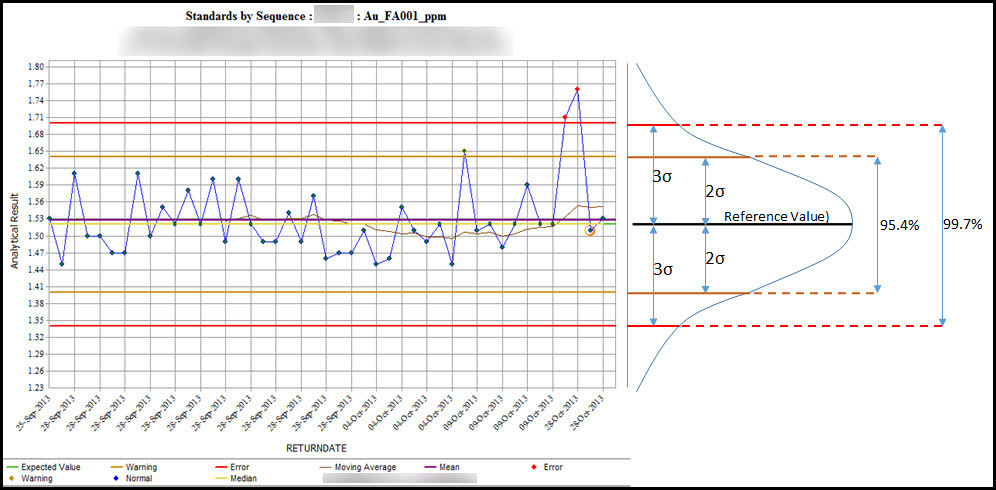
This is in line with a SQC approach. So long as measurements fall within the control lines and there are no patterns, any variation is considered random, and the process is ‘in control’. A fundamental assumption is the data is normally distributed.
The above image also shows another property of the normal distribution:
- 95.4% of data falls within 2 standard deviations of the mean and
- 99.7% falls within 3 standard deviations.
Or another way to look at this, for an ‘in control’ process:
- no more than 4.6% of data can be expected to fall outside of 2 standard deviations and
- no more than 0.3% can be expected to fall outside of 3 standard deviations.
The following image, shows the same chart with this property built into rules:
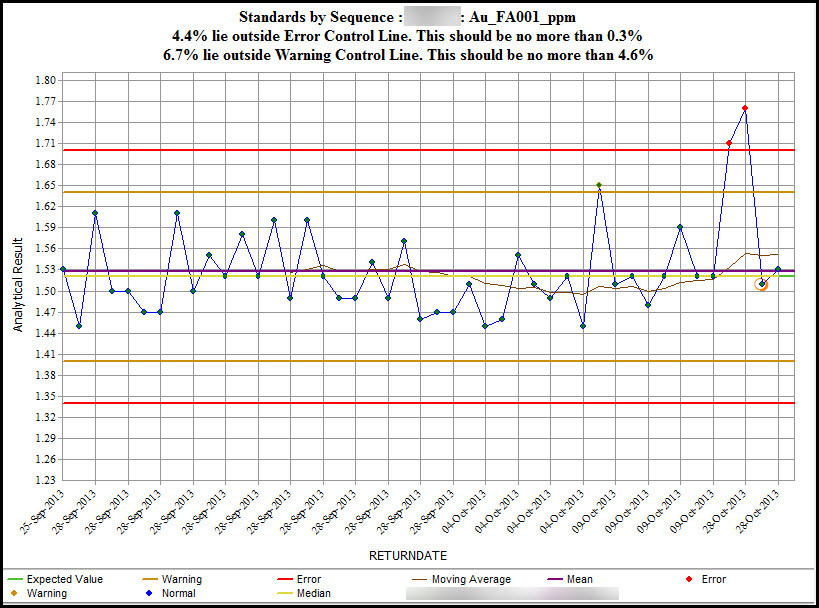
Of course, these identify acceptance/denial rules for the proportions of results under scrutiny according to the properties of the normal distribution. SQC also provides other rules. These include (and not limited to):
- Out of Control Signal 1: At least one point falls beyond the 3 standard deviation control line (anomaly?).
- Out of Control Signal 2: A run of nine consecutive points is on the same side of the RM value line (bias?).
- Out of Control Signal 3: At least two of three consecutive points lie beyond the 2 standard deviation control line on same side of the RM value line (anomalies?).
I mention these only to show what is possible using SQC.
Example:
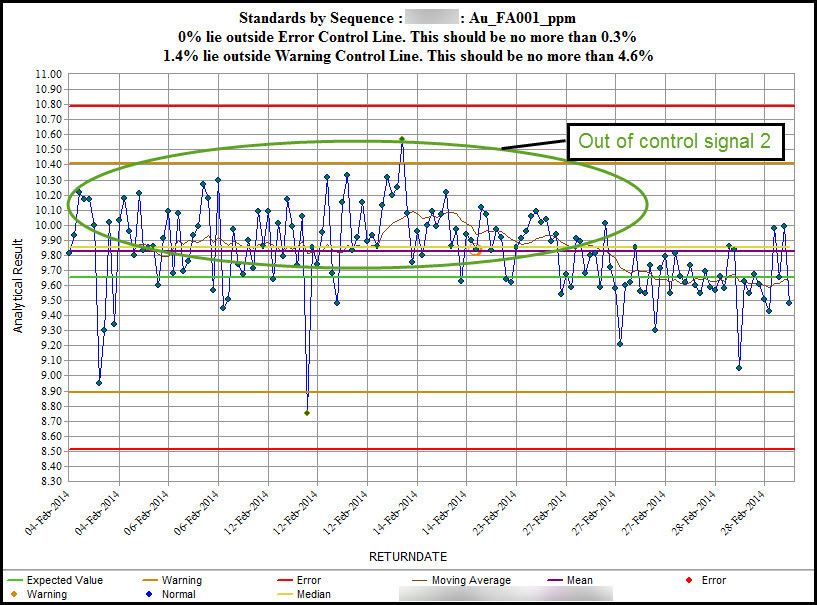
In the case of the image above, the out of control signal would have likely been picked up early in February.
The number of measurements appearing on the control chart really comes down to the needs of an organisation. The urgency with which results are required downstream (e.g. interpretations, geostatistics, modelling) often place pressure on the QAQC geoscientist, However, I would argue that a minimum of 35 measurements are required and should be ongoing (early values drop off as new results are received) for consistency.
In this article, I have referred to using the RM provided statistics for the derivation of control lines and associated rules. I acknowledge, however, that there may be reasons for using computed mean and standard deviation from the data. It would be useful to hear these.
The aim of this article is to alert you to SQC, and by example, demonstrate some features which may assist with the assessment of accuracy of analytical results. By incorporating salient aspects of SQC into your own processes, it is possible to reduce the level of subjectivity and, at the same time, provide a more systematic and statistically sound approach.
Resources
First published on LinkedIn, 31 January 2018. More on this topic: Control charts.