The Overview
The Overview in QC Analytical Results: the Overview shows one laboratory at a time, and everything from Lab Health down to the Key Takeaway belongs to Lab…
The Overview shows one laboratory at a time, and everything from Lab Health down to the Key Takeaway belongs to Lab Health. A project opened from Projects also shows Since last upload at the top. It says what the latest upload added or replaced, and which checks got worse or better. Select the blue line to list those checks, each with View to open its chart.
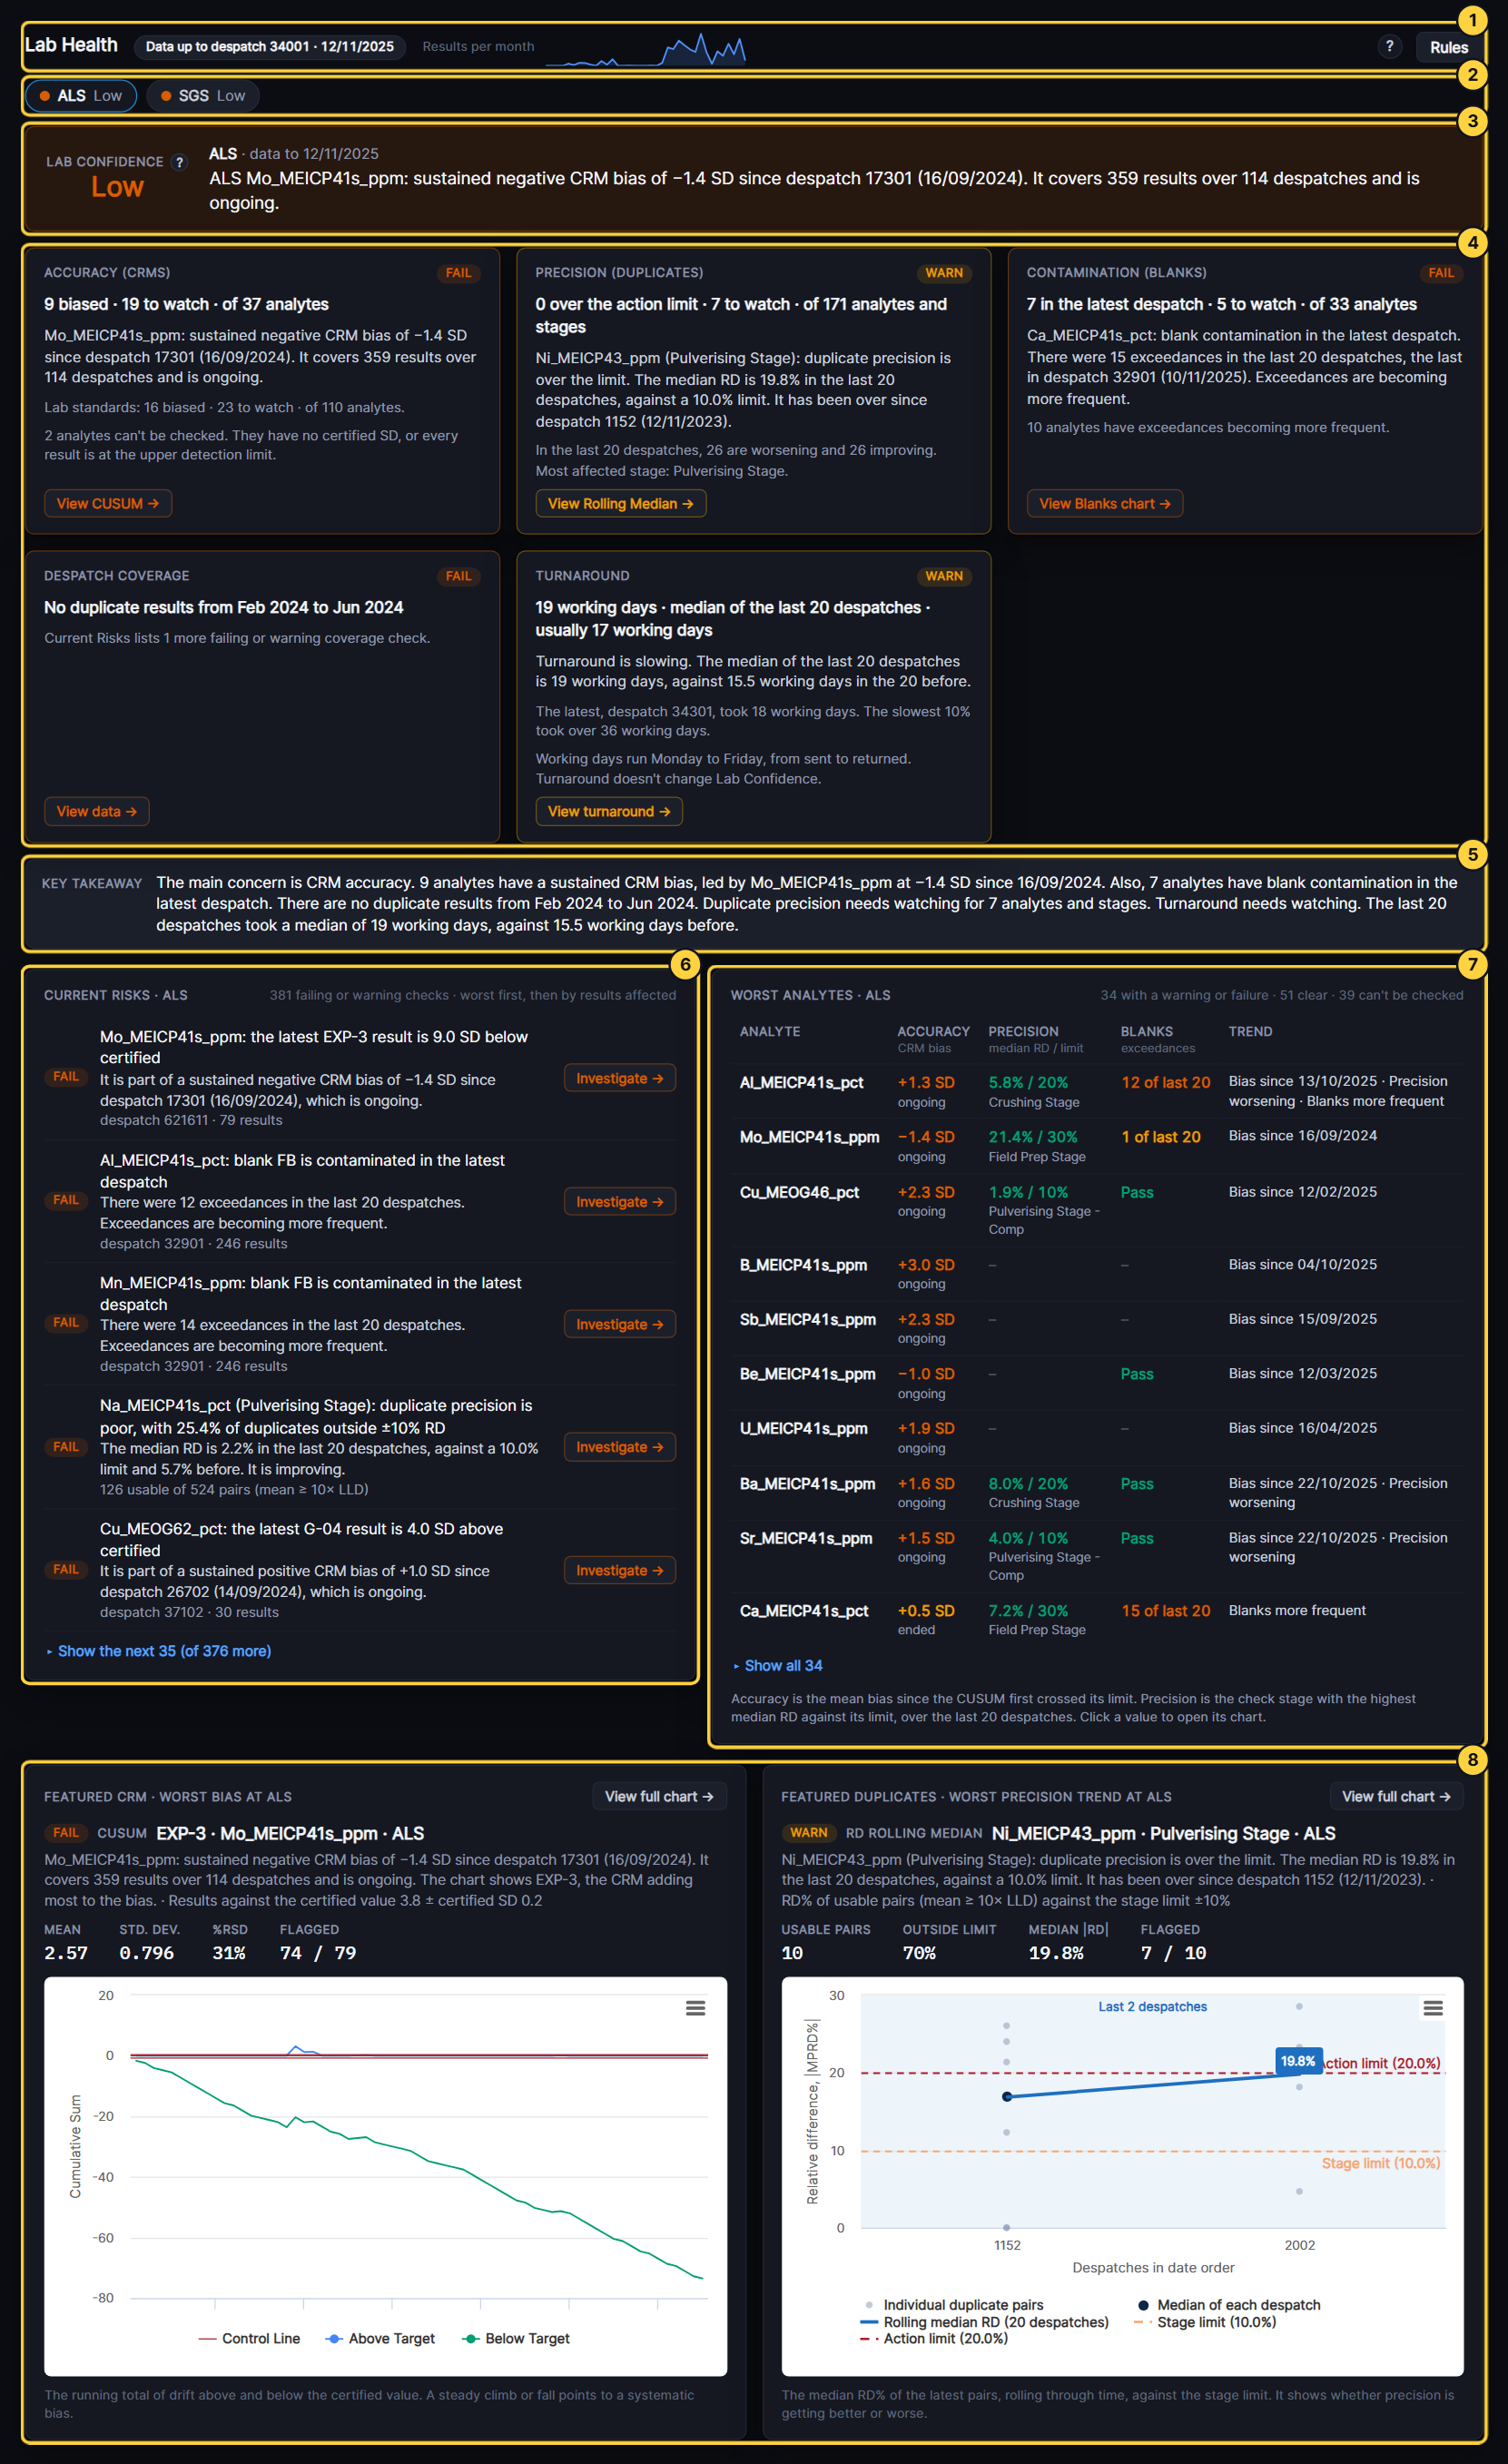
- Lab Health: Shows the latest return date and its despatch, and a chart of the results returned each month. The Rules button sets the limits the checks use.
- Lab switch: Picks the laboratory shown, and its dot shows its Lab Confidence. It opens on the lab with the newest data. If you change the Laboratory in the Filters on another tab, it follows.
- Lab Confidence and headline: Lab Confidence is High, Moderate, Low or Insufficient data. The headline gives the laboratory’s most serious finding in one sentence. A failure comes before a warning, then CRM bias, precision, blanks and coverage in that order. The ? beside Lab Confidence explains how each domain is rated.
- Domain cards: Accuracy (CRMs), Precision (duplicates), Contamination (blanks) and Despatch coverage each show a status, the worst finding and a button to the chart behind it. For coverage, the button opens the Data tab. Turnaround, the fifth card, compares the working days from send to return with the lab’s own history. View turnaround opens its chart, and Turnaround doesn’t change Lab Confidence.
- Key Takeaway: Sums up the laboratory: the main concern, what else to watch, and what is fine.
- Current Risks: Lists the laboratory’s failing and warning checks, worst first. Investigate or View data opens each one.
- Worst analytes: Gives each analyte with a warning or failure its own row, with CRM bias, duplicate precision, blank exceedances and trend. Select a value to open its chart.
- Featured charts: Shows the laboratory’s worst bias on a CUSUM chart and its worst precision trend on an RD Rolling Median chart. View full chart opens it on the Charts tab.